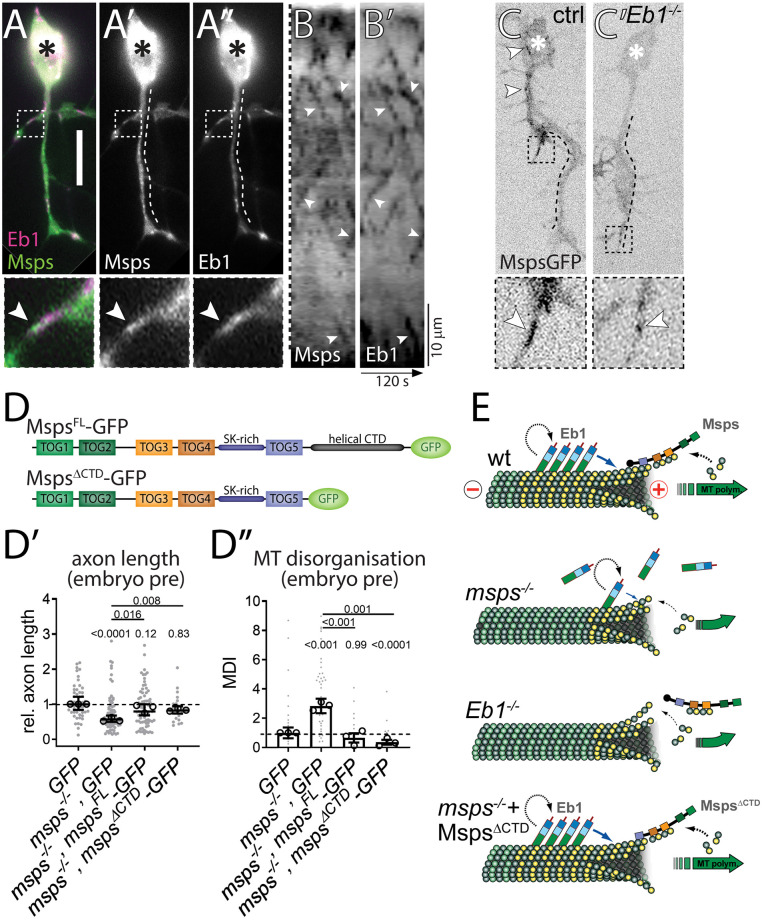
Fig 4. Eb1 and Msps depend on each other for MT plus-end localisation.
A-A”) Primary neurons at 6HIV co-expressing Eb1::mCherry (magenta, Eb1) and MspsFL::GFP (green, Msps) and imaged live; asterisks indicate somata, scale bar represents 10μm, dashed boxes indicate the positions of the 3.5-fold magnified close-ups shown at the bottom with arrowheads pointing at the position of Msps::GFP accumulation (same in C,C’). B,B’) Kymograph of live movies (as in A-A”) with the dashed line on the left representing a straightened version of the dashed lines shown in A’ and A” (i.e. the length of the axon; proximal at the top) and the x-axis indicating time; arrowheads point at trajectories of Msps and Eb1 which are almost identical. C) Primary neurons expressing Msps::GFP and imaged live, either displaying wild-type background (ctrl) or being homozygous mutant for Eb104524 (Eb1-/-); white arrowheads point at Msps::GFP comets which are much smaller in the mutant neurons. D) Schematic representations of MspsFL::GFP and MspsΔCTD::GFP. D’,D”) Graphs displaying axon length and MT curling (as indicated) for pre-cultured embryonic primary neurons expressing GFP or Msps::GFP constructs via the elav-Gal4 driver, either in wild-type or mspsA/1 mutant background; data were normalised to parallel controls (dashed horizontal lines) and are shown as median ± 95% confidence interval (D’) or mean ± SEM (D”) from at least two experimental repeats; large open circles in graphs indicate median/mean of independent biological repeats. P-values obtained with Kruskall-Wallis ANOVA tests are shown above data points/bars. E) Model view of the results shown here and in Fig 1; note that yellow circles represent GTP-tubulin which mediates the binding of Eb1; for further explanations see main text and Discussion. For raw data see S4 Data.

