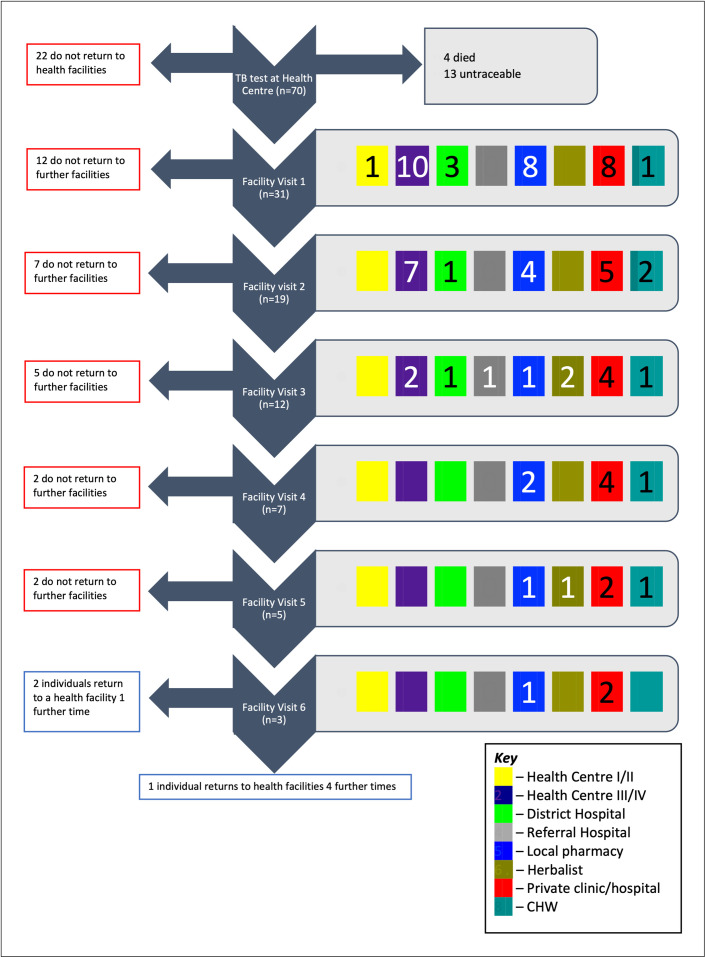
Fig 3. Patient pathways to care after TB evaluation.
Flowchart showing patient pathways to care after TB evaluation. To the right of each facility visit, coloured boxes represent the types of facilities participants visited (see Key). Numbers within the boxes represent the number of participants visiting that type of facility. Blank boxes indicate that facility type was not visited. If a participant visited a further facility, their next visit is recorded at the next step of the flow chart. If a participant did not visit a further facility, they exit the flow chart to the left of their current facility visit. CHW = Community Health Worker.

