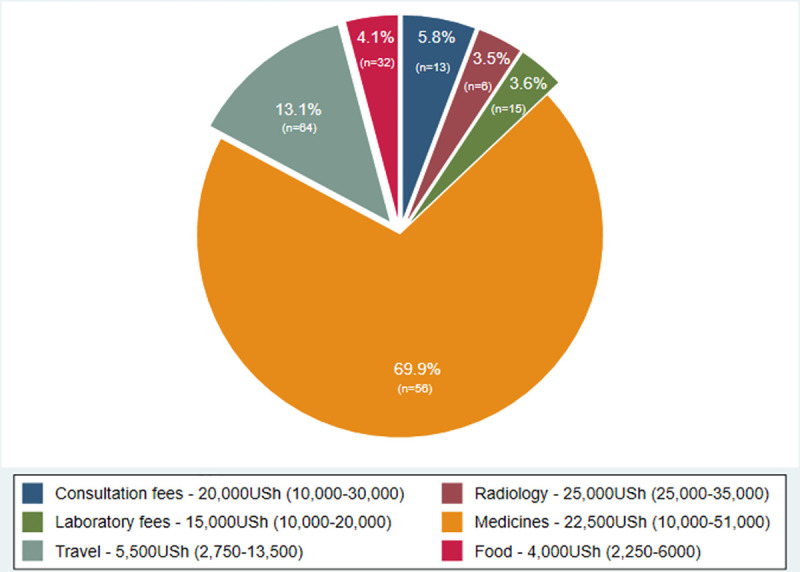
Fig 4. Distribution of direct costs during facility visits by study participants.

Direct costs incurred in 83 facility visits by the 31 study participants who returned to healthcare after TB evaluation. Slices represent the percentage of overall direct costs incurred by study participants by cost category (percentages labelled). The number of visits in which the specified cost category was accessed is also shown on the slices in brackets. The inner legend shows the median and inter-quartile range (in brackets) spent in that cost category, when accessed.
