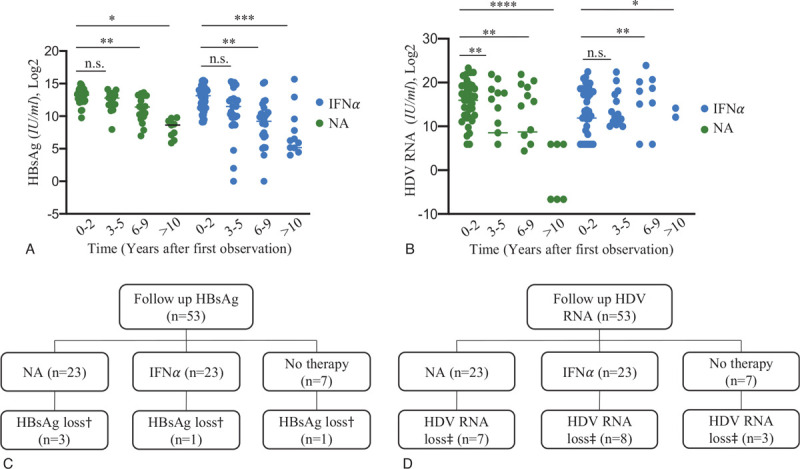
Figure 4.

(A) Course of HBsAg during follow-up in both antiviral treatment groups. Data are presented as mean (two-tailed Student's t-test) and plotted in Log2 scale. (B) Course of HDV RNA during follow-up in both antiviral treatment groups. Data are presented as mean (F-test) and plotted in Log2 scale. (C) Loss of HBsAg during follow-up according the 3 treatment groups. Undetectability of HBsAg could not show statistical significance, mostly due to the small number of cases. (D) HDV undetectability according the 3 treatment groups along follow-up. There was no significant difference in the achievement of HDV-RNA loss observed. Statistical significance, ∗P < .05; ∗∗P < .001; ∗∗∗P < .001; ∗∗∗∗P < .0001. †, loss of HBsAg at last observation; ‡, loss of HDV RNA at last observation. IFNα = interferon alpha, NA = nucleos(t)ide analogues.
