
FIGURE 2.
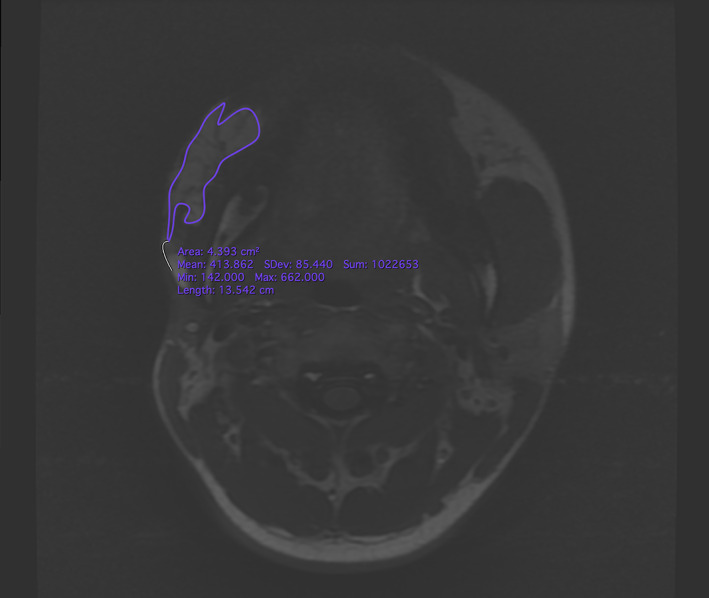
Magnetic resonance images and delineation of the subcutaneous adipose tissue. A region of interest (ROI) was precisely drawn on each axial slide by comprising pre‐ and post‐operational scans. After ensuring that the entire targeted subcutaneous adipose tissue was included in the ROIs, the volumes were calculated automatically