FIGURE 1.

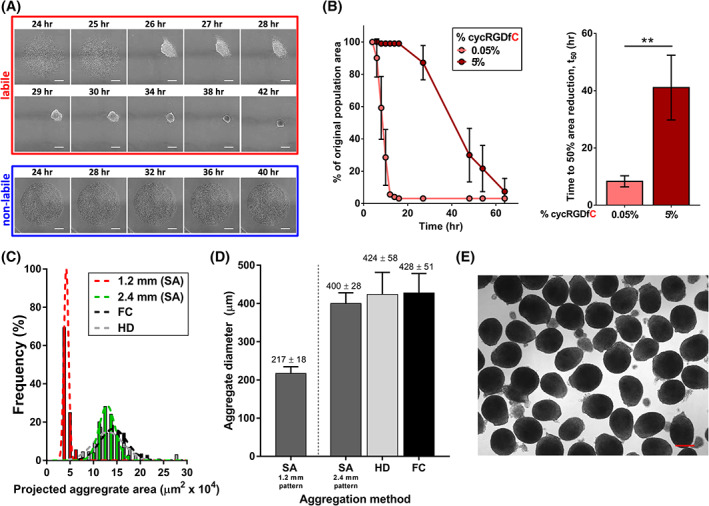
Generation of self‐assembled (SA) MSC aggregates with controllable size and kinetics from labile substrates. A, Time‐lapse images of MSCs on substrates presenting cyclic RGD (cycRGD) via a labile (top) or nonlabile (bottom) linkage. Labile substrates promote MSC self‐assembly into 3D cell aggregates, while nonlabile substrates promote continued MSC culture in 2D. Scale bars = 250 μm. B, (left) MSC aggregate self‐assembly kinetics (measured as percentage of original population area over time) as a function of initial peptide density on labile substrates. Error bars represent 95% CI (right). Mean t 50 values of self‐assembly for MSC aggregates generated from labile substrates of varying cycRGDfC density. “t 50” refers to the time required for the cell population to reach 50% of the original population area, previously established as a metric of aggregation kinetics. 32 Error bars represent 95% CI, **P < .01. C, Histogram of projected aggregate area for SA MSC aggregates generated from labile substrates (1.2 or 2.4 mm diameter circular patterns). Size distributions of HD and FC aggregates are overlaid for comparison (black and gray bars, respectively). D, Measurement of average size for day 0 MSC aggregates generated by SA from 1.2 and 2.4 mm diameter circular patterns, vs size‐matched HD and FC aggregates. E, Representative bright‐field image of day 0 SA MSC aggregates generated from 2.4 mm diameter circular patterns. Scale bar = 250 μm. FC, forced centrifugation; HD, hanging drop; MSC, mesenchymal stromal cell
