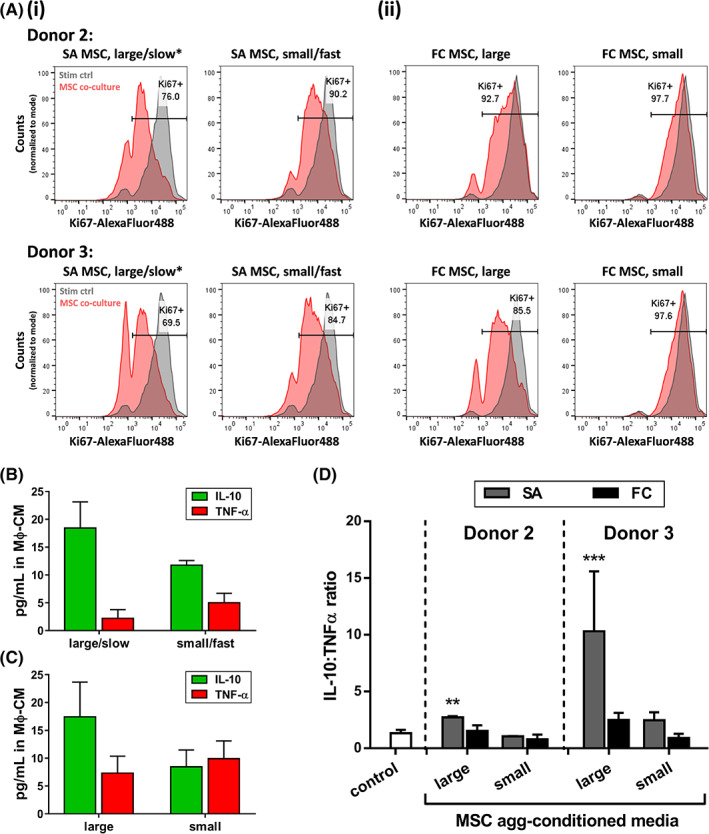
FIGURE 6.

Validation of DOE model in two different MSC donors. Immunomodulatory function of DOE‐optimized SA MSC aggregates was tested in two additional MSC donors. A, T‐cell suppression: Flow cytometry histograms of %Ki67+ CD3 T cells following indirect coculture with (i) SA MSC aggregates predicted by DOE to perform well (large/slow*) or poorly (small/fast), and (ii) large or small FC MSC aggregates, from two additional MSC donors. Gray histogram corresponding to stimulated PBMC control is shown in all plots for comparison. y‐axis displays cell counts, normalized to mode. At least 8000 CD3+ cells were counted per experimental condition. B,C, Macrophage polarization: Representative IL‐10 and TNF‐α concentrations measured in Mϕ‐CM from macrophages treated with MSC‐CM from (B) SA MSC and (C) FC MSC aggregates. Data shown for MSC donor 3. D, IL‐10:TNF‐α ratio in Mϕ‐CM from macrophages treated with media conditioned by MSC aggregates described in (A). Asterisks denote statistically significant differences relative to control (no treatment). **P < .01, ***P < .001; one‐way analysis of variance with multiple comparisons. DOE, Design of Experiments; FC, forced centrifugation; Mϕ‐CM, macrophage‐conditioned media; MSC, mesenchymal stromal cell; MSC‐CM, mesenchymal stromal cell‐conditioned media; SA, self‐assembled
