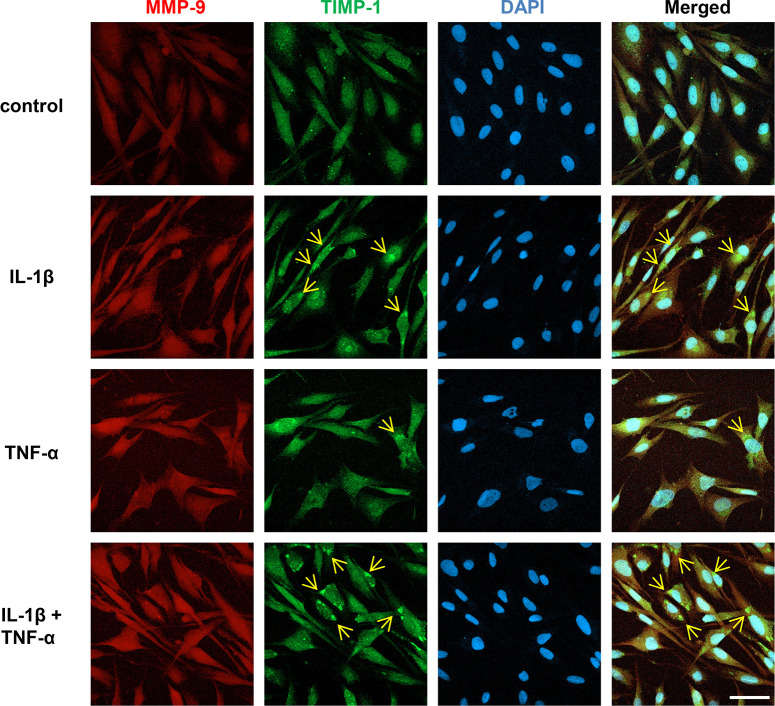
Fig 3. Effect of cytokine treatment on the intracellular MMP-9 and TIMP-1 distribution.
MIO-M1 cells were treated or untreated with IL-1β and/or TNF-α, each at 10 ng/mL in FBS-free media, alone or in combination, for 24 h, and then IHC confocal microscopy was performed to detect intracellular MMP-9 (red) and TIMP-1 (green) by dual-IHC staining using their specific primary and secondary fluorescent antibodies. Nuclear region is defined by chromatin staining with DAPI (blue). Representative micrographs of each treatment group are presented. Arrows point to immunoreactiveTIMP-1 aggregates. Scale bars, 50 μm.

