
Figure 4: Whole section imaging of liver sections for quantification of immune cells reveals CD4+ T cell and CD8+ T cell tissue infiltration is associated with tumor prevention.
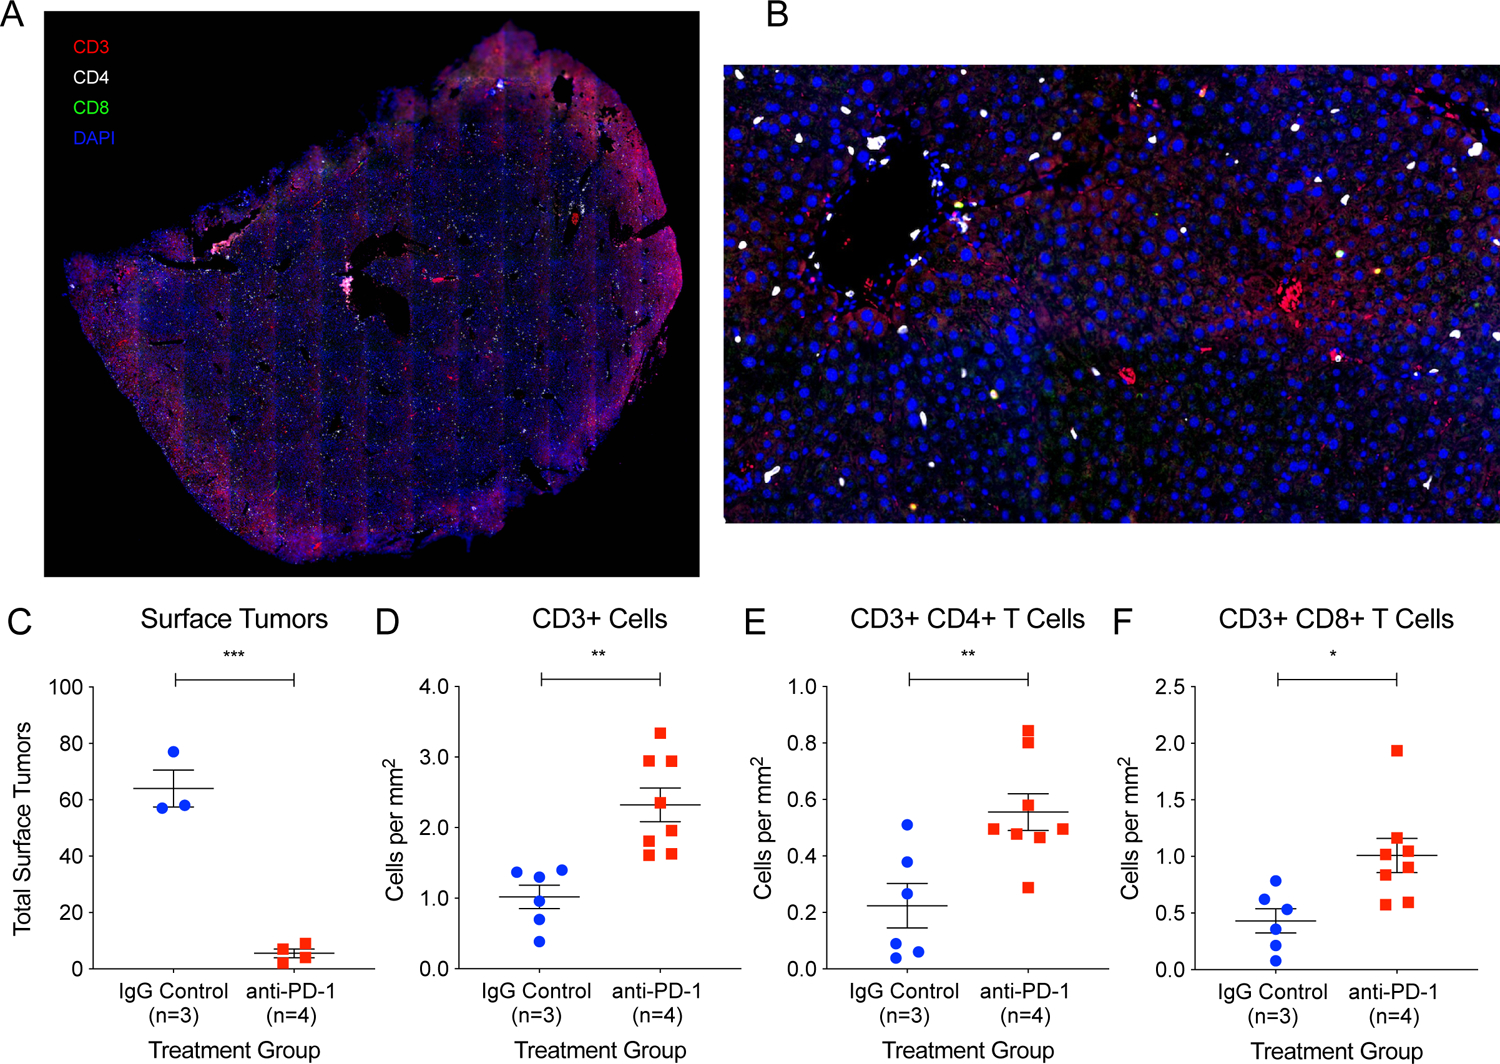
(A) Whole liver section from an anti-PD-1 treated animal immunostained for CD3 (red), CD4 (white), and CD8 (green) imaged using an AxioScan slide scanner microscope system. (B) Inset of (A). (C) Three animals with significant tumor burden in the IgG control group and four animals with minimal tumor burden in the anti-PD-1 group were analyzed using the immunostaining protocol and image analysis pipeline described. Two liver sections from each animal were analyzed for T cell infiltration. The total area analyzed for IgG control liver sections was 225.43 mm2 and for anti-PD-1 liver sections was 281.82 mm2. There were significantly increased infiltrating (D) CD3+ cells, (E) CD3+ CD4+ T cells, and (F) CD3+ CD8+ T cells in the livers of the anti-PD-1 animals. Two tailed student’s t tests were performed for the data shown in 3C-F. All data are presented as mean ± SEM. *p < 0.05, **p < 0.01, ***p < 0.001.