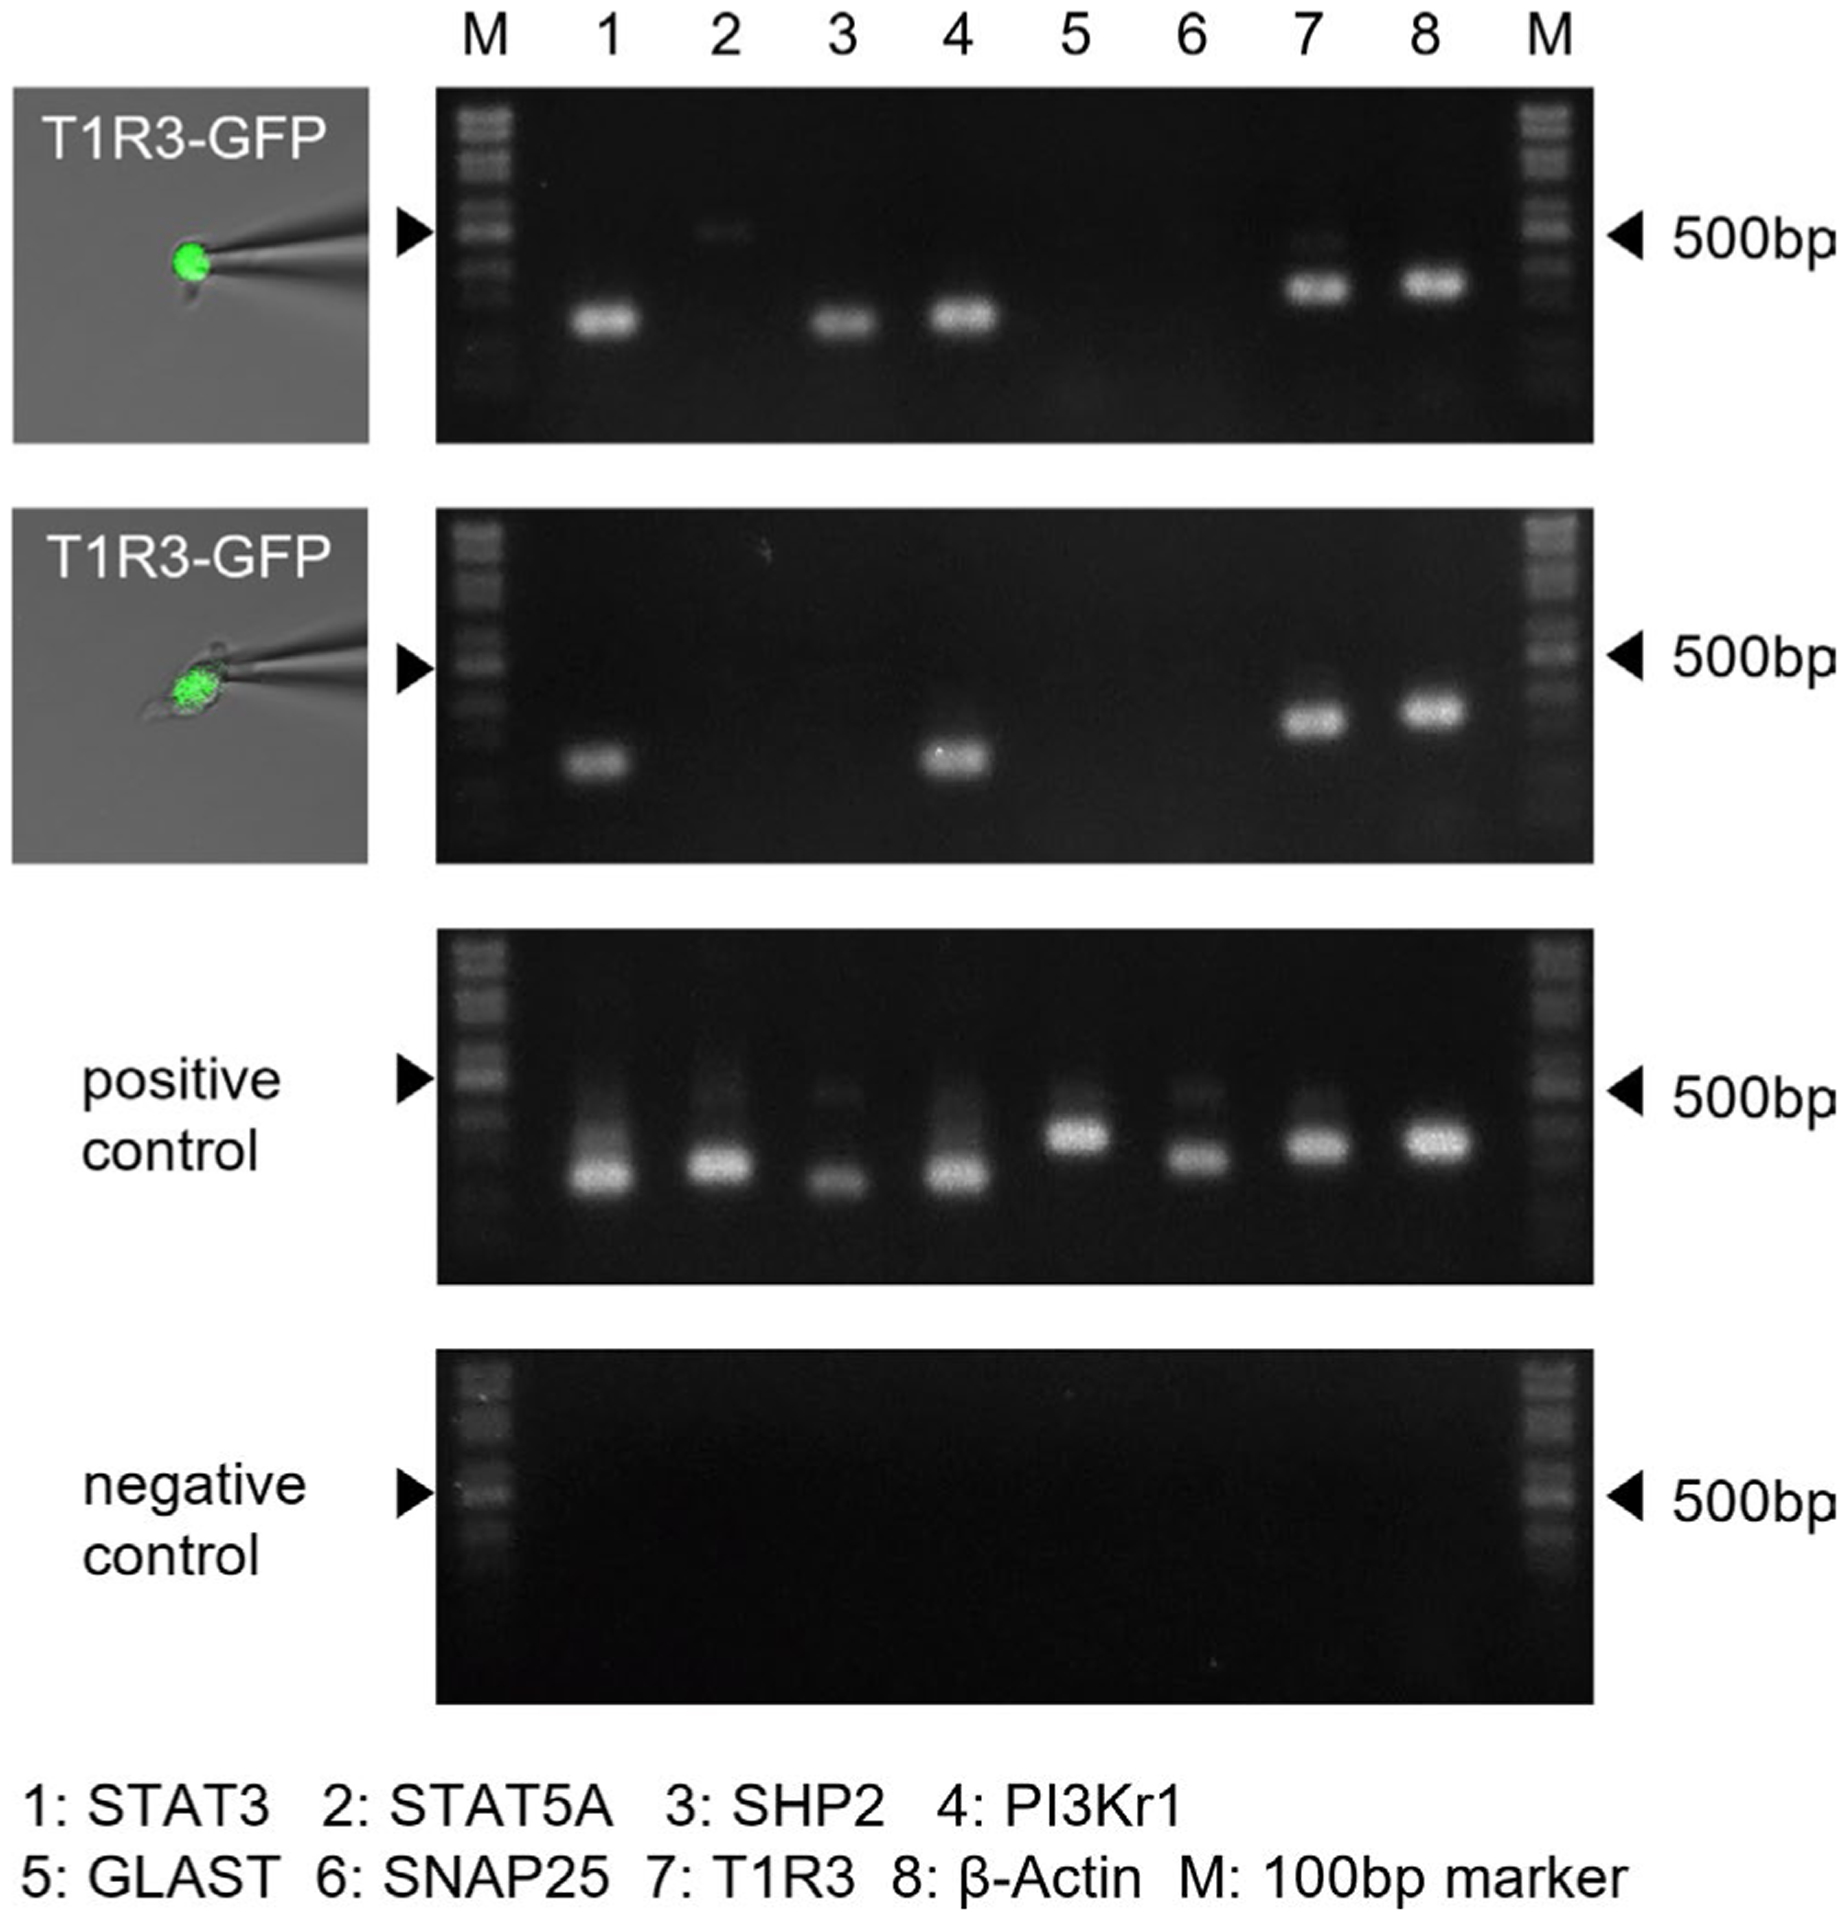
FIGURE 2.

Gene expression analysis of taste receptor family 1 member 3 (T1R3)-positive taste cells (TCs) by single-cell RT-PCR. Examples of single-cell RT-PCR from typical profiled cells. After harvesting single T1R3-green fluorescent protein (GFP) TCs (left pictures), gene expression (signal transducer and activator of transcription 3 [STAT3], STAT5a, Src homology region 2 domain-containing phosphatase-2 [SHP2], phosphoinositide 3-kinase [PI3Kr1], glutamate/aspartate transporter [GLAST], SNAP25, T1R3, β-actin) was analyzed by multiplex single-cell RT-PCR (right pictures showing second PCR reaction products). Positive and negative control reactions were always run in parallel with reactions with samples. Arrowheads indicate marker bands of 500 bp. Summarized data are shown in Table 2
