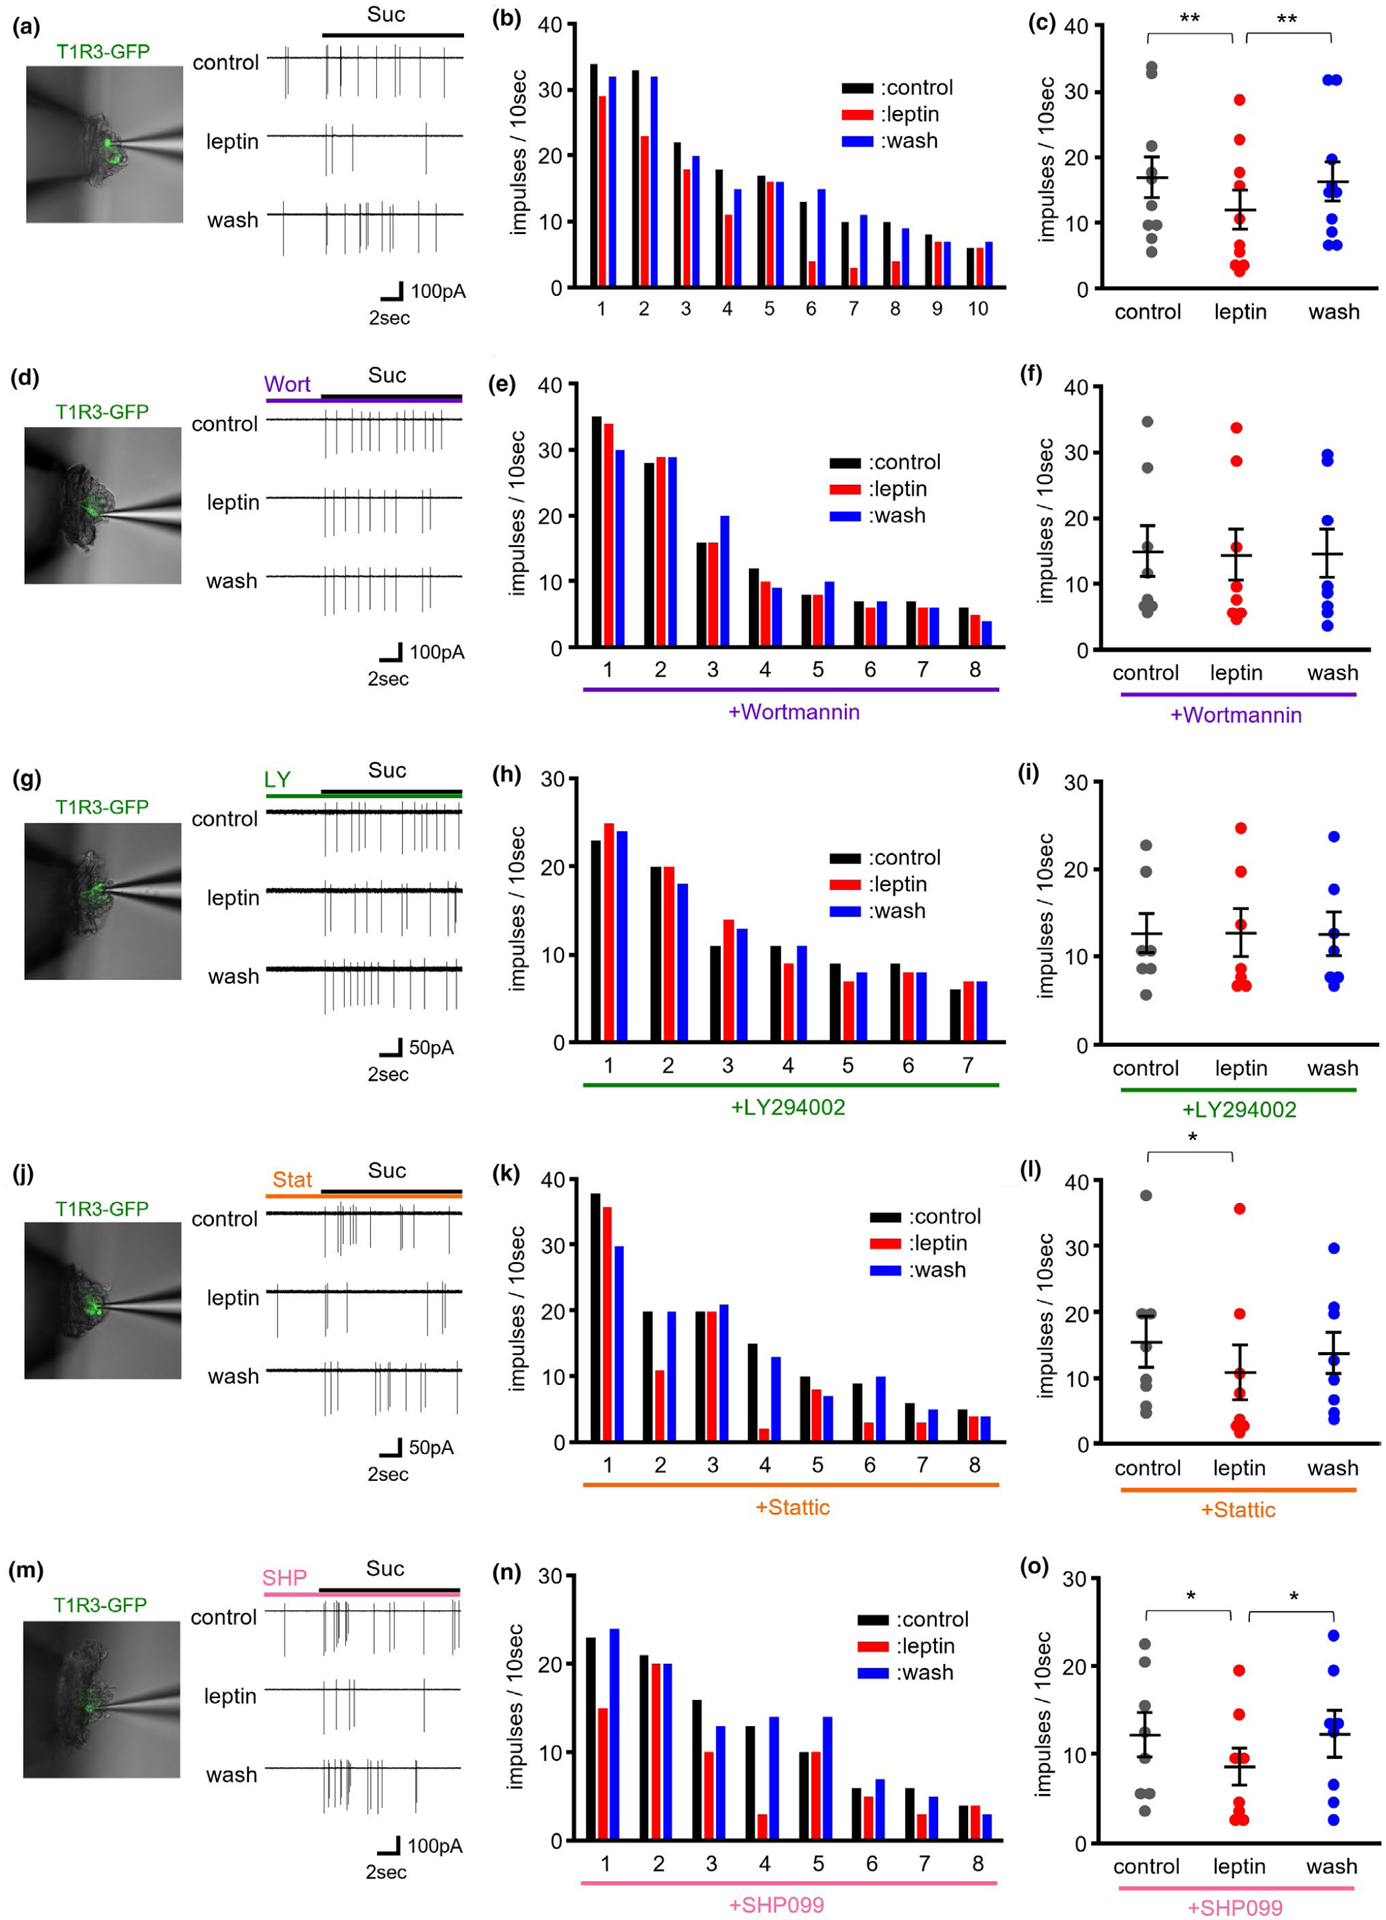
FIGURE 3.

Effect of bath applied leptin on sucrose responses of taste receptor family 1 member 3 (T1R3)-green fluorescent protein (GFP) taste cells (TCs) from mouse fungiform papillae. (a) Sample recordings of TC responses to 500 mM sucrose (Suc) before (cont), during (leptin) and after (wash) treatment with 20 ng/ml leptin. The picture shows a T1R3-GFP TC from which taste responses were recorded. (b). Responses of 10 individual T1R3-GFP TCs to 500 mM sucrose before (left), during (middle) and after (right) treatment of 20 ng/ml leptin. (c) Effects of leptin on summated responses of T1R3-GFP TCs to 500 mM sucrose (n = 10 cells/ 9 mice, F = 14.869, p < .001, repeated ANOVA). Values are means ± SE. (d–i) Phosphoinositide 3-kinase (PI3K) inhibitors suppressed leptin’s suppression of TC responses to sucrose. (d, g) Sample recordings of TC responses to 500 mM sucrose (Suc) before (cont), during (leptin) and after (wash) treatment with 20 ng/ml leptin. PI3K inhibitor wortmannin (30 nM, d) or LY294002 (30 μM, g) was added to bath solution throughout the experiment. The picture shows a T1R3-GFP TC from which taste responses were recorded. (e, h) Responses of 8 and 7 individual T1R3-GFP TCs to 500 mM sucrose before (left), during (middle) and after (right) treatment of 20 ng/ml leptin under the existence of 30 nM wortmannin (e) or 30 μM LY294002 (h). (f, i) The effects of leptin on summated responses of T1R3-GFP TCs to 500 mM sucrose under the existence of 30 nM wortmannin (n = 8 cells/ 7 mice, F = 0.3577, p > .1, repeated ANOVA, f) or 30 μM LY294002 (n = 7 cells/ 7 mice, F = 0.0375, p > .1, repeated ANOVA, i). Values are means ± SE. (j–o) Signal transducer and activator of transcription 3 (STAT3) inhibitor and Src homology region 2 domain-containing phosphatase-2 (SHP2) inhibitor did not affect leptin’s suppression of TC responses to sucrose. (j, m) Sample recordings of TC responses to 500 mM sucrose (Suc) before (cont), during (leptin) and after (wash) treatment with 20 ng/ml leptin. STAT3 inhibitor stattic (10 μM, i) or SHP2 inhibitor SHP099 (10 μM, m) was added to bath solution throughout the experiment. The picture shows a T1R3-GFP TC from which taste responses were recorded. (k, n) Responses of 8 individual T1R3-GFP TCs to 500 mM sucrose before (left), during (middle) and after (right) treatment of 20 ng/ml leptin under the existence of 10 μM stattic (k) or 10 μM SHP099 (n). (l, o) Effects of leptin on summated responses of T1R3-GFP TCs to 500 mM sucrose under the existence of 10 μM stattic (n = 8 cells/ 8 mice, F = 4.0694, p < .05, repeated ANOVA, l) or 10 μM SHP099 (n = 8 cells/ 7 mice, F = 5.8569, p < .05, repeated ANOVA, o). Values are means ± SE. **p < .01, *p < .05, post hoc paired t-test with Holm correction
