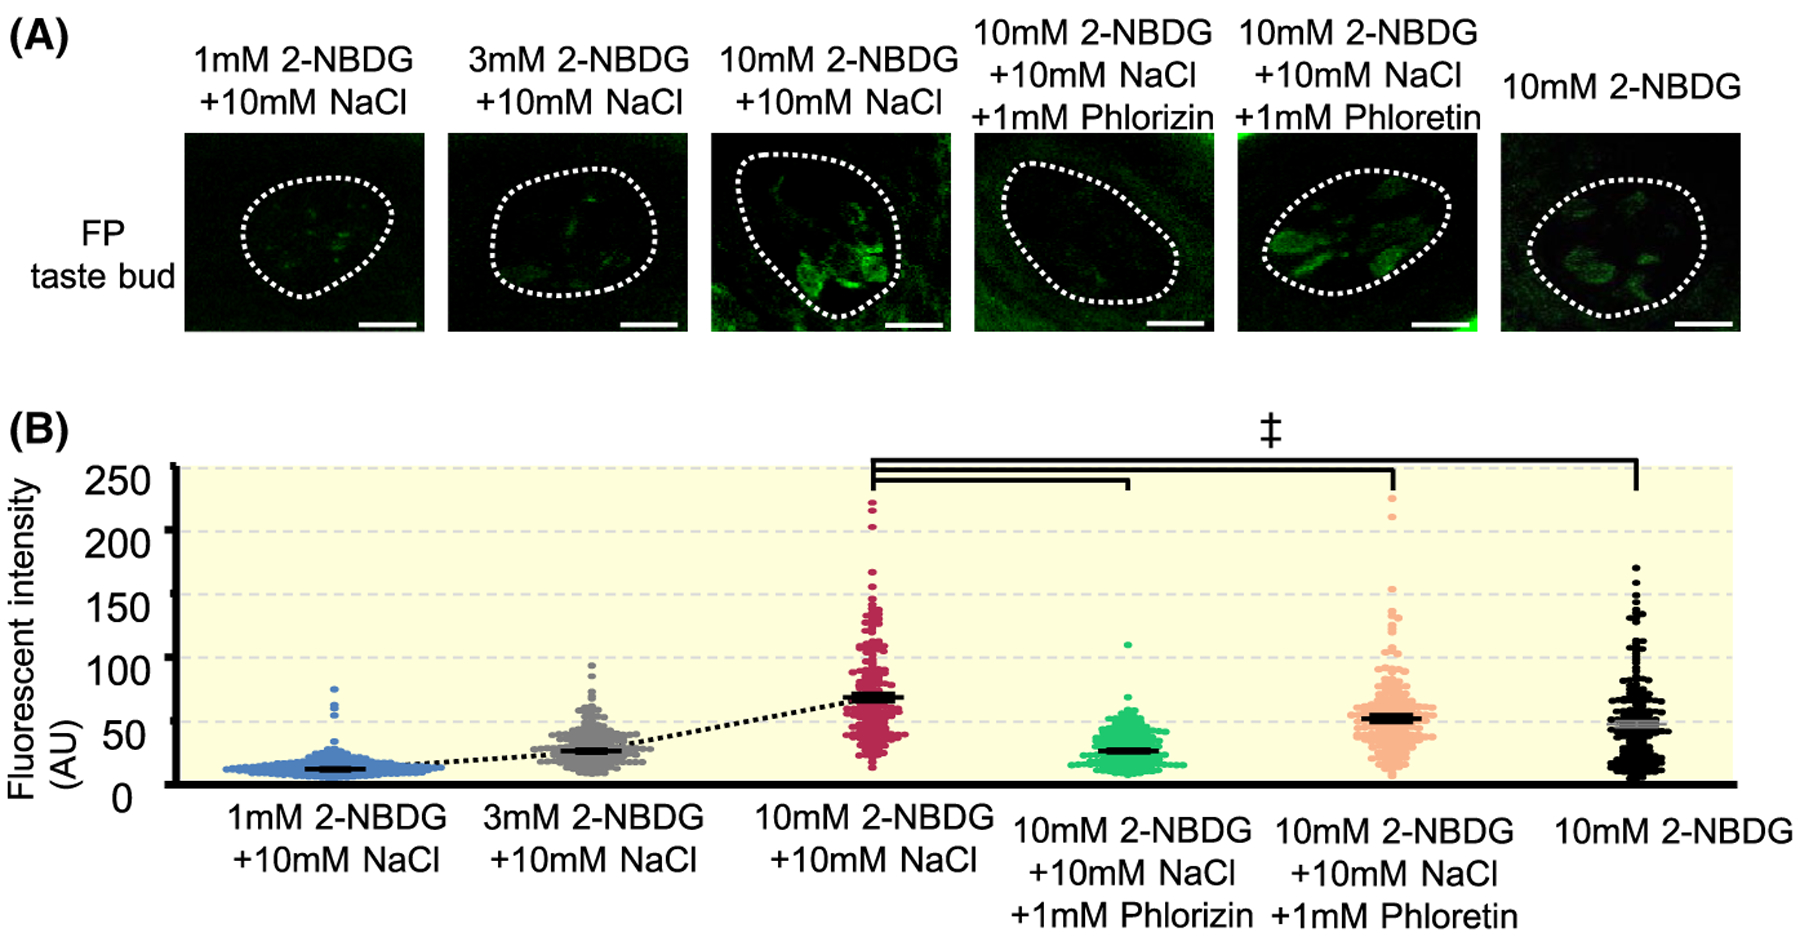
FIGURE 5.

2-NBDG uptake by taste cells in the intact mouse tongue. A, Representative images of fungiform taste buds after apical treatment of 2-NBDG with different conditions. Dotted lines indicate the outlines of taste buds. Scale bar, 10 μm. B, Fluorescent intensities (arbitrary unit: AU) of taste buds after apical treatment of 2-NBDG with different conditions (1 mmol/L 2-NBDG + 10 mmol/L NaCl, 3 mmol/L 2-NBDG + 10 mmol/L NaCl, 10 mmol/L 2-NBDG + 10 mmol/L NaCl, 10 mmol/L 2-NBDG + 10 mmol/L NaCl + 1 mmol/L Phlorizin, 10 mmol/L 2-NBDG + 10 mmol/L NaCl + 1 mmol/L Phloretin and 10 mmol/L 2-NBDG). Each dot represents fluorescent intensity of each taste bud (10th optical section from the apical side). Data were obtained from three animals for each condition (58–60 taste buds for each animal). Summarized data are shown in means ± SE. F = 55.65, P < .001, one-way ANOVA test. ‡P < .001, Tukey HSD test
