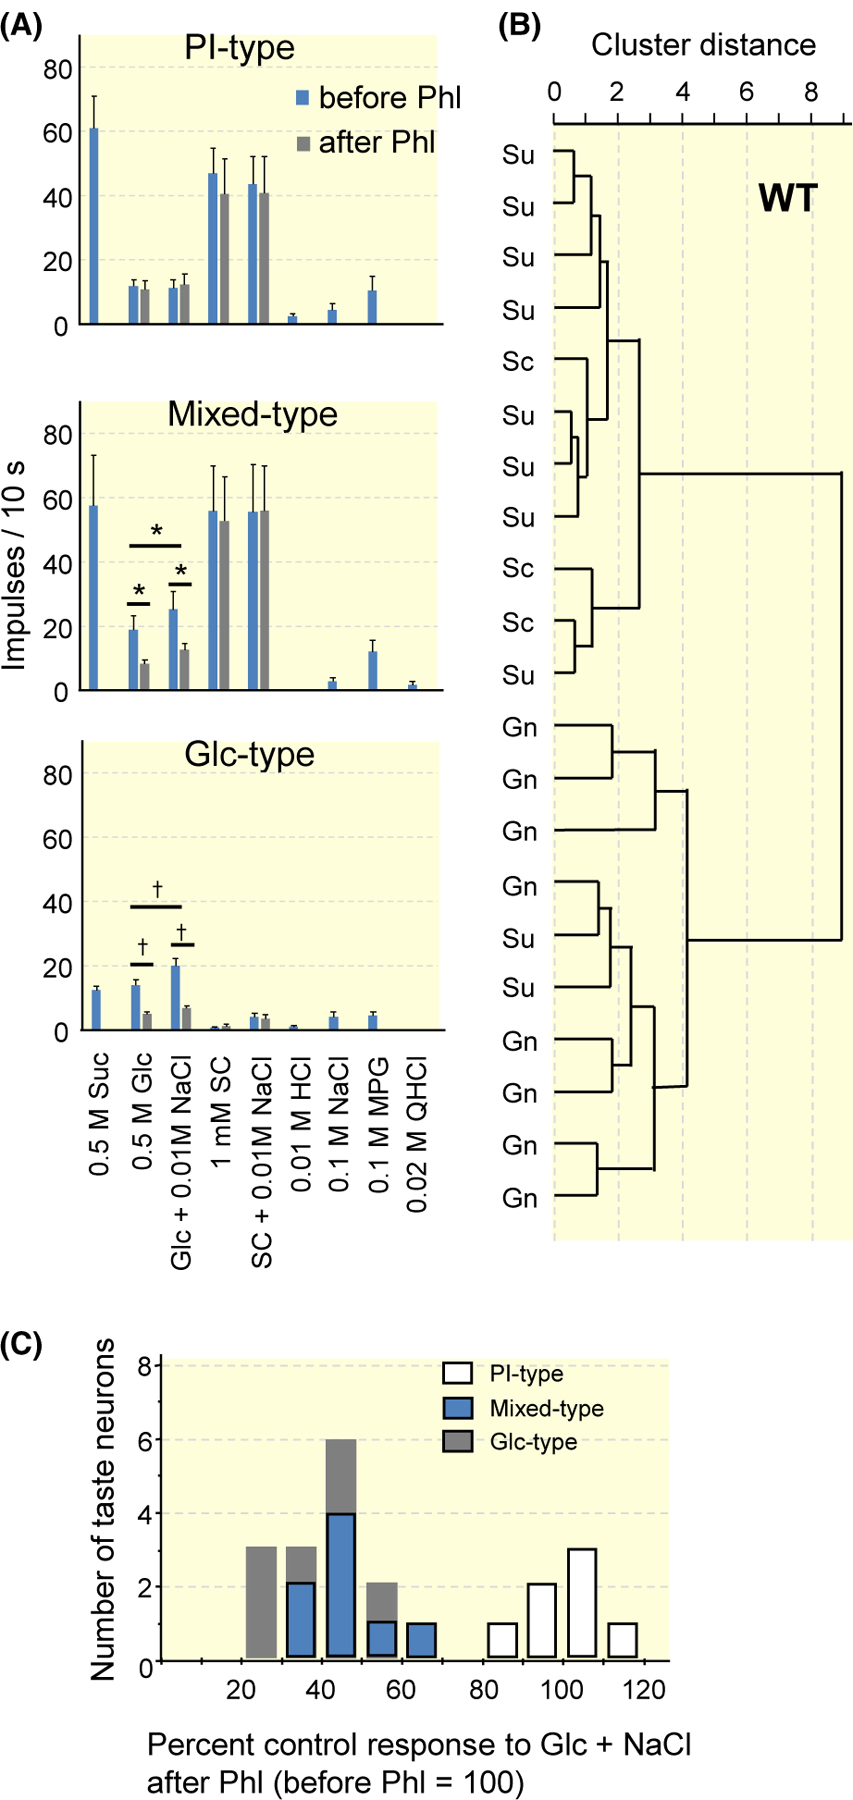
FIGURE 8.

Results of single-fibre recordings from the chorda tympani nerves of WT mice. A, Response profiles of PI- (Suc SC-best), Mix- and Glc-type fibres. Stimuli are 0.5 mol/L sucrose (Suc), 0.5 mol/L glucose (Glc), 0.5 mol/L Glc + 10 mmol/L NaCl, 1 mmol/L SC45647 (SC), SC + 10 mmol/L NaCl, 10 mmol/L HCl, 0.1 mol/L NaCl, 0.1 mol/L monopotassium glutamate (MPG), 20 mmol/L quinine HCl (QHCl). Each column indicates the mean number of net impulses per 10 seconds (mean response) ± SE. Results of paired t test for the effect of the addition of 10 mmol/L NaCl and the effect of 1 mmol/L phlorizin (Phl) on response to Glc are shown in Table 6 and Table 7 respectively; *P < .05, †P < .01. B, Results from hierarchical cluster analysis according to responses to taste stimuli tested. Su, Sc and Gn indicate the stimulus producing the maximal response among Suc, SC and Glc + NaCl in the fibre. C, Fibre distribution by means of Phl sensitivity of the fibres in response to 0.5 mol/L Glc + 10 mmol/L NaCl. WT, wild-type
