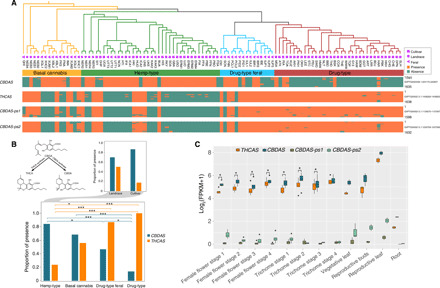
Fig. 3. Evolution of CBDAS and THCAS.

(A) Occurrence of CBDA-synthase gene (CBDAS), THCA-synthase gene (THCAS), and two CBDAS pseudogenes across 104 Cannabis accessions, based on mapping to a reference genome having both genes and many pseudogene copies of them [Jamaican Lion DASH (42)]. Cladogram on top and symbols are as in Fig. 1. For sample codes, see table S1. Below the cladogram is indicated for each gene whether reads from each sample mapped to the reference positions. The height of each gene box represents the length of the gene. The Jamaica Lion DASH genome sequence coordinates for the four genes are shown on the right. (B) Top left: Phytocannabinoids CBDA and THCA result from a biosynthetic reaction catalyzed respectively by the enzymes CBDA and THCA synthase from the common precursor CBGA. Bottom: The proportion of CBDAS and THCAS in each of the four groups. Top right: The proportion of CBDAS and THCAS in landraces versus cultivars within the Hemp-type group. Fisher’s exact test, *P < 0.05; ***P < 0.001. (C) Transcriptomic expression for the two genes and pseudogenes in different tissues and vegetative stages [data from (47)]. Wilcoxon rank-sum test, *P < 0.05.
