
Fig. 3. Contagiograms: Augmented time series charting the social amplification of n-grams.
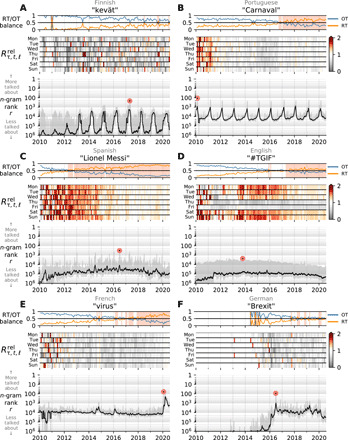
In each contagiogram, above the basic n-gram rank time series, the top panel displays the monthly relative usage of each n-gram, Rτ, t, 𝓁 (Eq. 1), indicating whether they appear organically in new tweets (OT, blue) or in retweeted content (RT, orange). The shaded areas denote months when the balance favors spreading, suggestive of story contagion. The middle (second) panel then shows retweet usage of an n-gram relative to the background rate of retweeting, (Eq. 2). (A and B) The seasonal cycle of the 1-gram spring in Finnish is different from the annual cycle of the word Carnaval in Portuguese. Spring is often mentioned in organic tweets, while the balance of the word Carnaval favors retweets exceeding the social contagion threshold starting from 2017. (C) The time series for “Lionel Messi” in Spanish tweets exhibits a similar pattern of social amplification as a famous soccer player who is talked about regularly. (D) The hashtag #TGIF (“Thank God It’s Friday”) shows a strong weekly cycle, relatively unamplified on Thursday and Friday. (E) The time series of the 1-gram virus in French shows strong relative retweeting following global news about the early spread of COVID-19 in 2020–2021. (F) We observe mild spikes at the beginning of the German dialog around the withdrawal of the United Kingdom from the European Union shifting to an even balance of the 1-gram Brexit across organic and retweeted content.