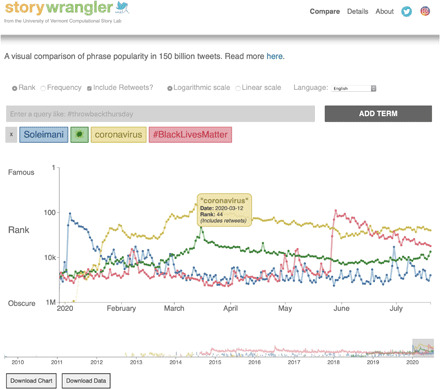
Fig. 6. Interactive online viewer.

Screenshot of the Storywrangler site showing example Twitter n-gram time series for the first half of 2020. The series reflect three global events: the assassination of Iranian general Qasem Soleimani by the United States on 3 January 2020, the COVID-19 pandemic (the virus emoji and coronavirus), and the Black Lives Matter protests following the murder of George Floyd by Minneapolis police (#BlackLivesMatter). The n-gram Storywrangler dataset for Twitter records the full ecology of text elements, including punctuation, hashtags, handles, and emojis. The default view is for n-gram (Zipfian) rank at the day scale (Eastern Time), a logarithmic y axis, and for retweets to be included. These settings can be respectively switched to normalized frequency, linear scale, and organic tweets (OT) only. The displayed time range can be adjusted with the selector at the bottom, and all data are downloadable.
