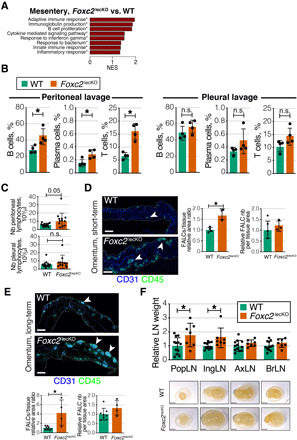
Fig. 2. Foxc2 deficiency generates organ-specific immune response.

(A) Pathways enriched in transcriptomes of 10-week depleted Foxc2lecKO versus WT mesenteries. n = 3 WT; n = 4 Foxc2lecKO. NES, normalized enrichment score. Asterisks: Adjusted P value ≤ 0.05. (B) Increased percentage of CD45+B220+CD19+ B cells, CD45+B220+CD19+GL7−CD138+ plasma cells, and CD45+CD90+CD19− T cells in the peritoneal, but not pleural cavity of Foxc2lecKO mice. *P ≤ 0.05; n = 4 WT; n = 4 Foxc2lecKO. n.s., not significant. (C) Total lymphocyte number in the peritoneal and pleural cavities of WT and long-term depleted Foxc2lecKO mice. *P < 0.05; n = 14 WT; n = 12 Foxc2lecKO. (D) Increased size, but not number, of omental FALCs after short-term, 5-week Foxc2 depletion. Green, CD45; blue, CD31. Scale bars, 400 μm. *P < 0.05; n = 4 WT; n = 3 Foxc2lecKO. (E) Increased size, but not number, of omental FALCs after long-term Foxc2 depletion. Green, CD45; blue, CD31. Scale bars, 400 μm. *P < 0.01; n = 8 WT; n = 4 Foxc2lecKO. (F) Normalized weights of popliteal (popLN), inguinal (ingLN), axillary (axLN), and brachial (BrLN) LNs 16 weeks after Foxc2 deletion. *P < 0.05; n = 12 WT; n = 7 Foxc2lecKO mice. Scale bars, 2 mm. Data are means ± SD.
