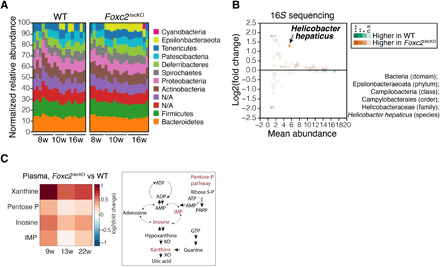
Fig. 5. Foxc2 loss modifies gut microbiome and increases circulating levels of purine metabolites.

(A) A higher proportion of Foxc2lecKO mice harbor members of the phylum Epsilonbacteraeota after 2 months of Foxc2 depletion. Stacked bar plots: relative bacterial amplicon sequence variant (ASV) abundance at the phylum level 8 weeks (n = 7 WT, n = 6 Foxc2lecKO), 10 weeks (n = 4 WT, n = 8 Foxc2lecKO), and 16 weeks (n = 7 WT, n = 7 Foxc2lecKO) after Foxc2 deletion. (B) Increased abundance of H. hepaticus in Foxc2lecKO mice. MA plot: The mean relative bacterial species abundance versus the log-transformed fold change of bacterial species relative abundance in the feces of WT and 8- to 16-week depleted Foxc2lecKO mice. Circles, species with calculated fold change abundance; triangles, species with infinite fold difference due to zero abundance. Color intensity proportional to the relative species abundance. n = 18 WT, n = 21 Foxc2lecKO. (C) Increased blood xanthine levels in Foxc2lecKO mice. Heatmap: Fold change of induced (red) or reduced (blue) metabolites in Foxc2lecKO versus WT mice. n = 6 WT, n = 7 Foxc2lecKO mice. Metabolites ordered by m/z (mass/charge ratio), adjusted P < 0.05. On the right, purine metabolic pathway is depicted.
