
Fig. 7. Single-cell transcriptome profiling defines molecular and functional subsets of adult LECs.
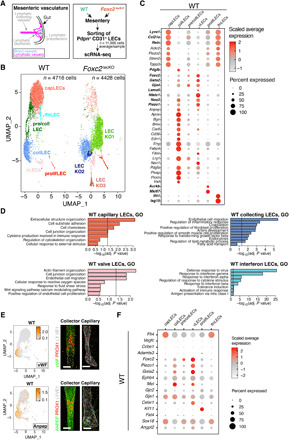
(A) Workflow of the scRNA-seq experiment. Cells were sorted from mesenteries of 6-week-old WT and Foxc2lecKO mice 3 weeks after Foxc2 depletion. n = 3 per genotype. (B) UMAP plot of WT and Foxc2lecKO LECs. Six major clusters of LECs in WT mice and nine major clusters in Foxc2lecKO mice were identified. (C) Dot plot of known markers (in bold) and selected new genes for WT LEC clusters: capillary (capLECs), collecting (collLECs), precollecting and collecting (pre/collLECs), valve (vLECs), proliferative (prolifLECs), and IFN (IfnLECs). The color code indicates scaled average expression level in each cluster, and the dot size indicates the percent of cells in each cluster expressing the given gene. (D) Bar plots of a subset of GO gene sets that were overrepresented among genes up-regulated in capLEC, collLEC, vLEC, and IfnLEC clusters of WT mice. (E) Expression level per cell (ln[normalized counts + 1]) of the new WT LEC markers vWF and Anpep overlaid on the UMAP and staining of adult mesenteric lymphatic collLVs and capillaries showing expression of vWF or ANPEP (green) and PROX1 (red). Scale bars, 50 μm. (F) Dot plot of expression of hereditary lymphedema–related genes in adult LEC subsets of WT mice. The color code indicates scaled average expression level in each cluster, and the dot size indicates the percent of cells in each cluster expressing the given gene.