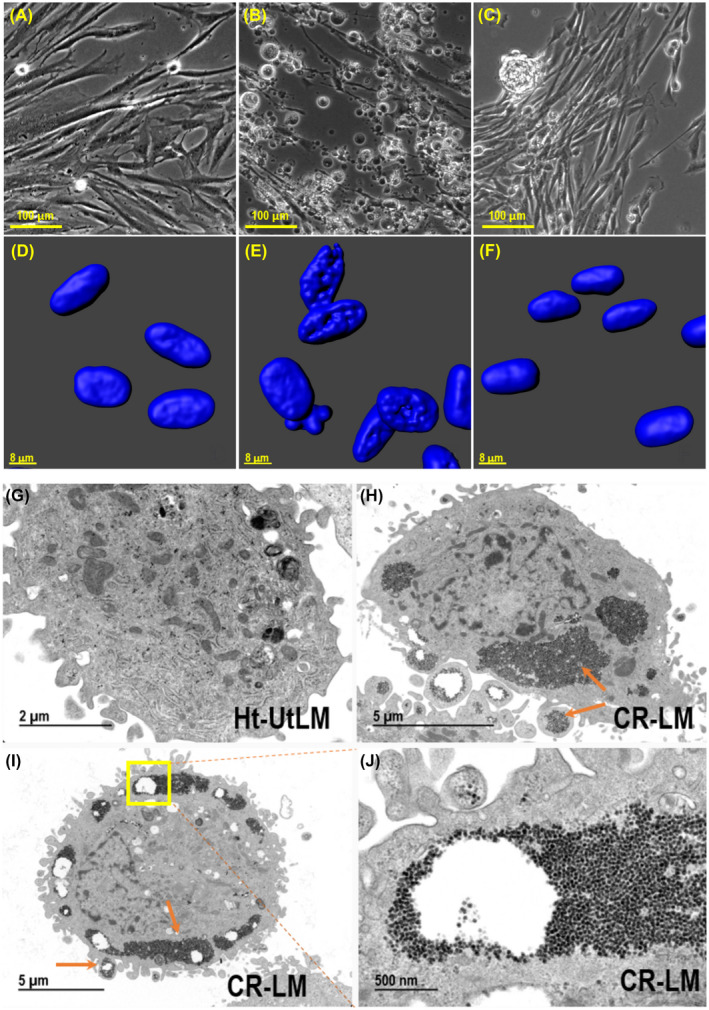
FIGURE 1.

The effects of 10 μM Cd exposure on ht‐UtLM cells and ultrastructural characteristics of ht‐UtLM and 8‐week Cd‐exposed ht‐UtLM cells (designated CR‐LM). A, No Cd exposure; (B) Cd exposure for 1 week. (C) Cd exposure for 8 weeks. Bottom row: The Z‐stack images acquired with Zeiss LSM 880 confocal microscope, DAPI signal only. D, No Cd exposure; (E) Cd exposure for 1 week; (F) Cd exposure for 8 weeks. Ultrastructural images: (G) Ht‐UtLM cell; (H) CR‐LM cell; note the peripheral cytoplasmic accumulations of glycogen; (I) CR‐LM cell; (J) Higher magnification of region in box shown in panel (I). A–C (scale bar = 100 µm); D–F (scale bar = 8 µm); G (scale bar = 2 µm); H and I (scale bar = 5 µm); J (scale bar = 500 nm)
