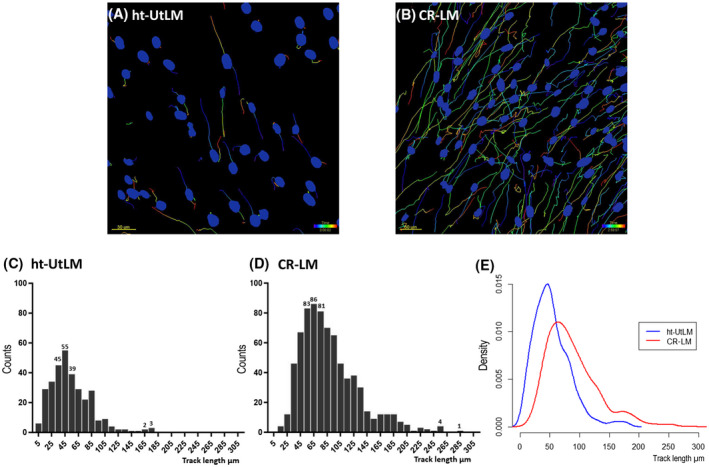
FIGURE 4.

Prolonged Cd exposure stimulated cell motility in CR‐LM cells. A and B, The full track visualization of time‐lapse experiments for ht‐UtLM (A) and CR‐LM (B) cells, respectively. C and D, Frequency distribution of the track length values for ht‐UtLM (C) and CR‐LM (D) cells as shown in the histograms. E, The superimposed track length distributions of ht‐UtLM and CR‐LM cells by probability density plotted by density function with RStudio.
