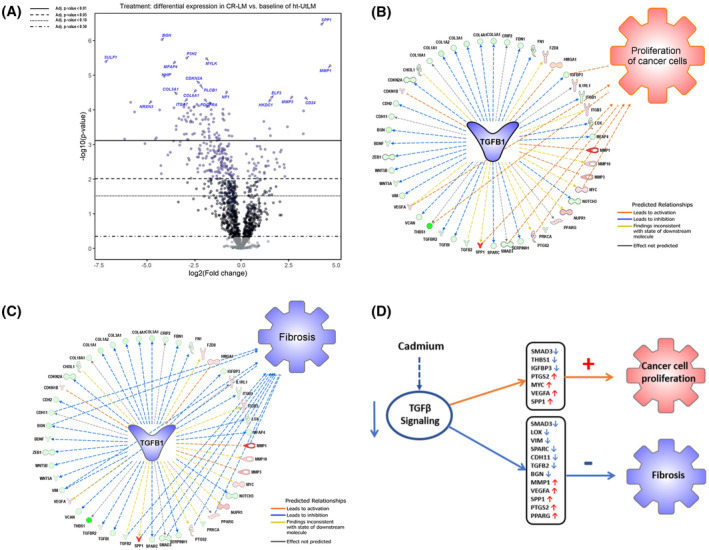
FIGURE 5.

Cd exposure induced differentially expressed genes and signaling pathway changes. A, Volcano plot of altered gene expression patterns in Cd‐exposed CR‐LM cells. The volcano plot shows each gene's −log10(P‐value) and log2 fold change with the chosen covariate. Highly significant genes fall at the top of the plot and those genes highly and differentially expressed fall to either side. The horizontal lines indicate different false discovery rate (FDR) thresholds. Genes are colored if the resulting P‐value is below the given FDR threshold. The 20 most statistically significant genes are labeled. B, IPA predicted that the inhibited TGFB1 signaling favored cancer cell proliferation. Among the 47 nodes (molecules) within the TGFB1 network, seven relationship lines were identified to be associated with activation of cancer cell proliferation. The nodes implicated as having proliferative stimulatory effects (orange lines) were SPP1, MYC, VEGFA, PTGS2, IGFBP3, SMAD3, and THBS1. C, IPA predicted that the inhibited TGFB1 signaling in CR‐LM suppressed fibrosis. Among the 47 nodes within the TGFB1 network, 12 relationship lines were identified to be associated with the suppression of fibrosis. The nodes implicated as having an inhibitory effect (blue lines) were MMP1, LOX, CDH1, BGN, VIM, VEGFA, TGFB2, SPP1, SPARC, SMAD3, PTGS2 and PPARG. D, IPA analysis predicted that Cd exposure inhibits TGFB signaling, promotes cell proliferation, and inhibits fibrosis
