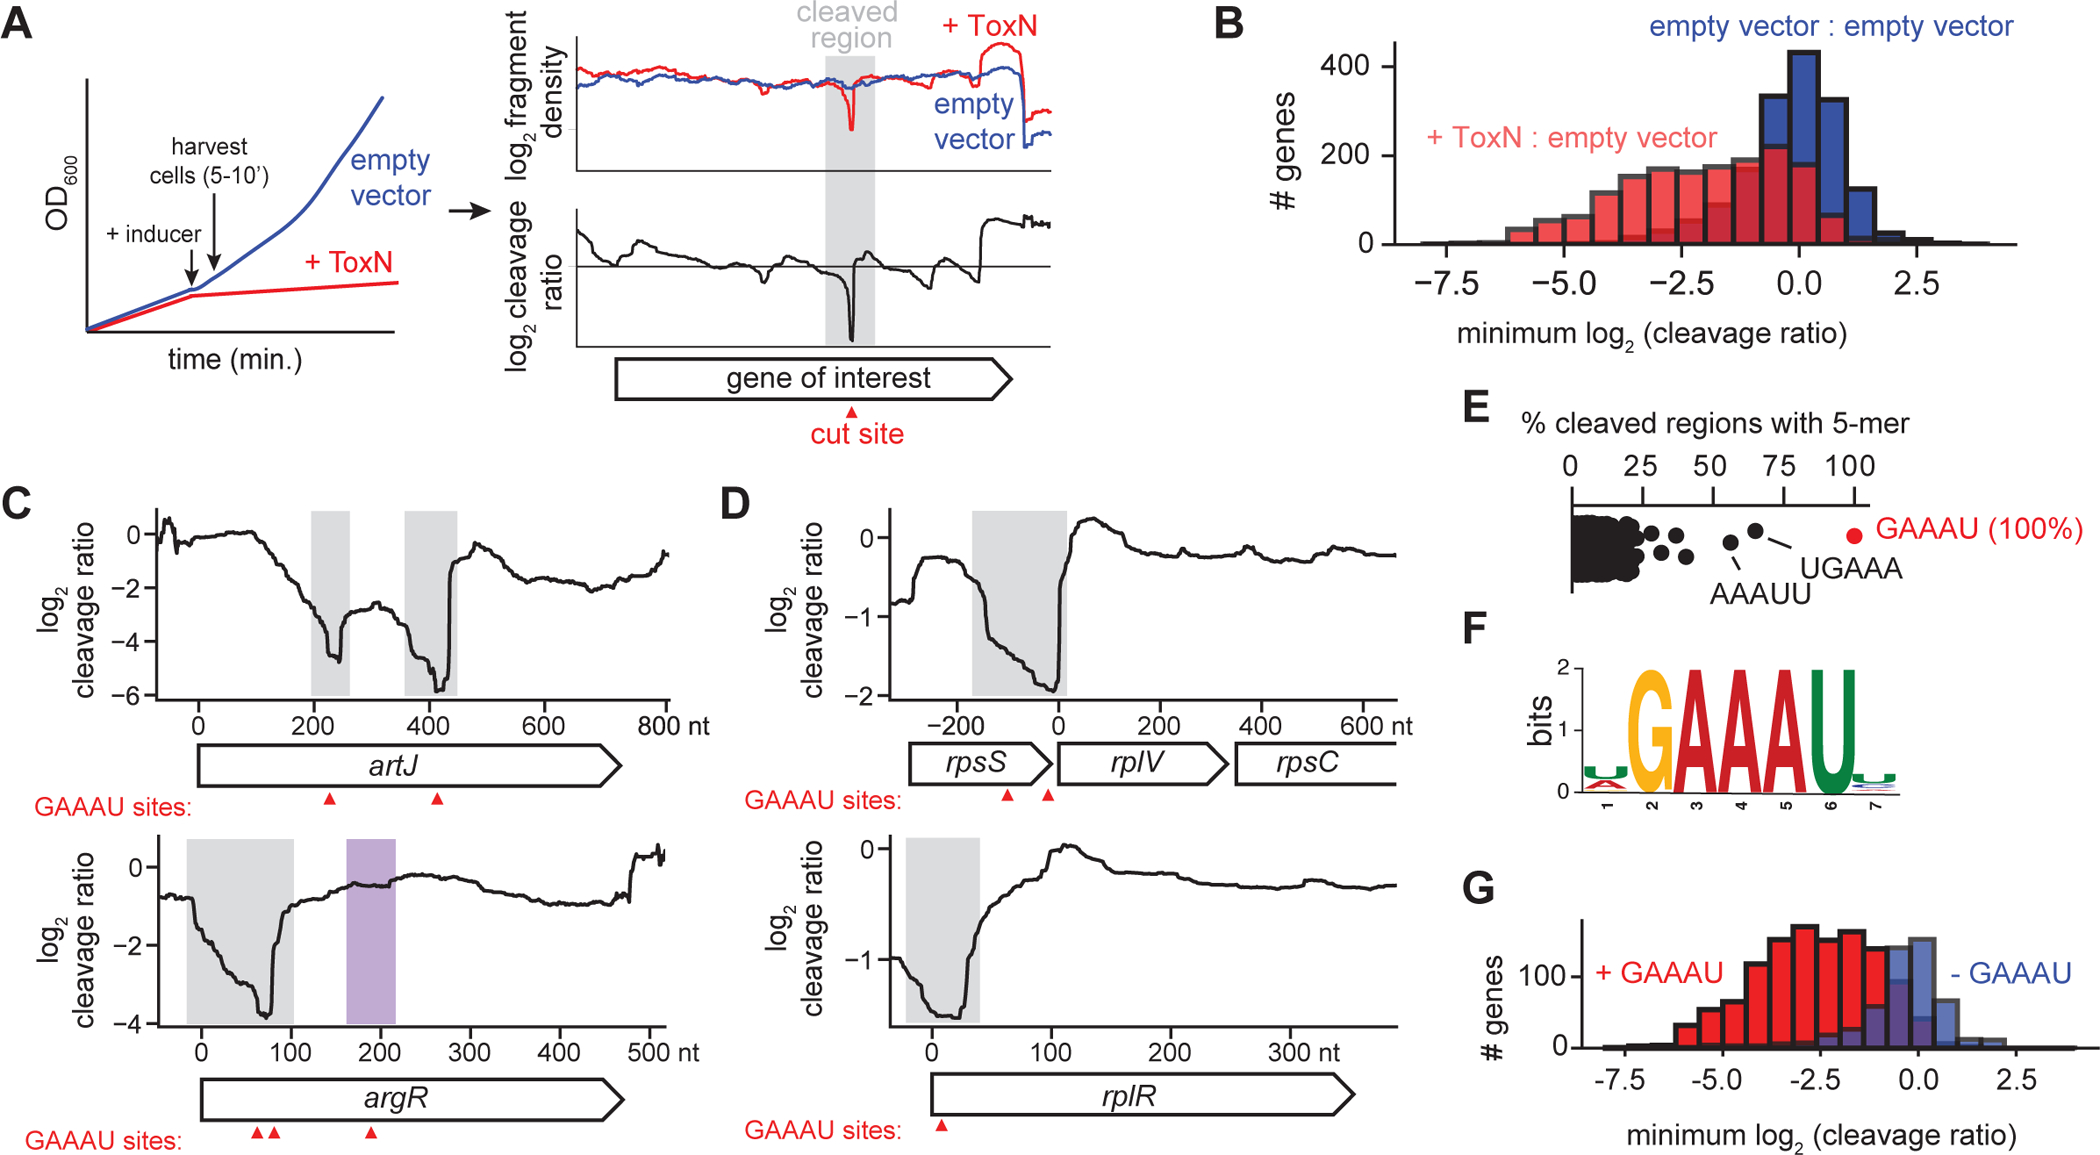
Fig. 2. ToxN is a sequence-specific endoribonuclease.

(A) Schematic overview of RNA-seq approach for determining ToxN cleavage sites.
(B) Histograms showing the distribution of the minimum cleavage ratios within well-expressed coding regions (n = 1,717) in E. coli when comparing cells overexpressing ToxN to those harboring an empty vector (red) or comparing two independent replicates harboring an empty vector (blue).
(C-D) Cleavage profiles for four well-cleaved E. coli transcripts. Sites of GAAAU motifs are indicated with red triangles. Well-cleaved instances of GAAAU are highlighted in gray, and a poorly cleaved region containing the motif is highlighted in purple.
(E) Percent of well-cleaved regions containing each possible 5-mer.
(F) Sequence logo for well-cleaved regions.
(G) Histograms showing the distribution of the minimum cleavage ratios within well-expressed coding regions in E. coli with (red, n = 1,195) and without (blue, n = 522) the ToxN motif.
Also see Fig. S2.
