
TABLE 1.
Mean orientation and positioning accuracy (in percent of the nominal or mean dimension of the continuum flexible segment) for different PCR designs.
| Design | Image | DoF | Structure | Models | Calibration | (%) | (°) |
|---|---|---|---|---|---|---|---|
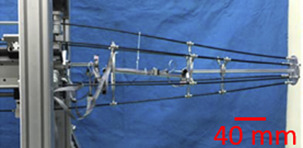
| Orekhov et al. (2016) |

|
6 | 6 PF | Cosserat | No | 2.8 | 3.81 |
| Yang et al. (2018) |

|
3 | 3PFF | Cosserat | No | 0.1 | - |
| Wu et al. (2017) |
|
3 | Multi | Neural Network | No | 0.43 | - |
| Wu and Shi (2019) | Constraint | Cosserat | Yes | 0.8 | - | ||
| Nuelle et al. (2020) |

|
3 | 3PFR | Constant Curvature | Yes | 1.4 | 1.1 |