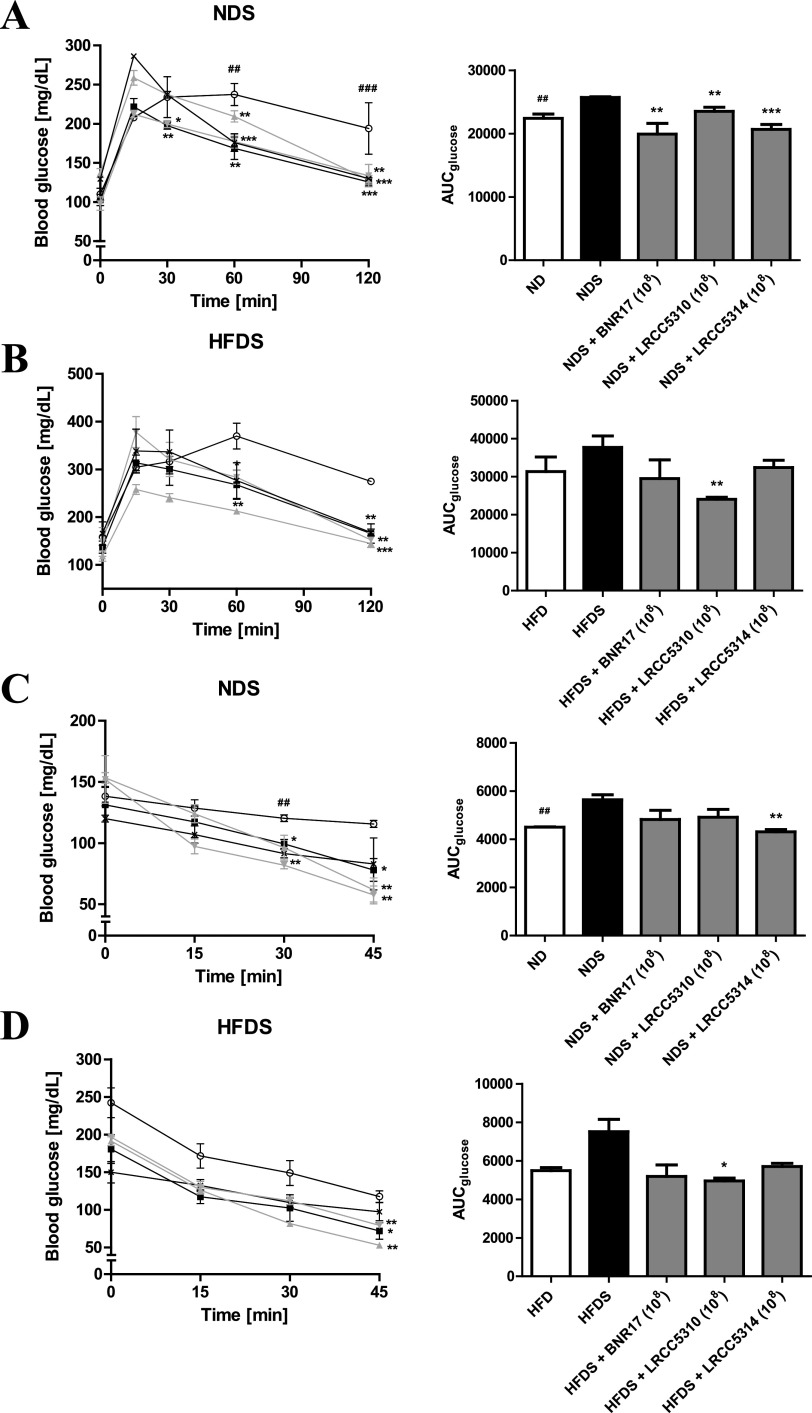
FIG 3.
IPGTT and IPITT of cold-stress-induced, high-fat diet-fed mice treated with LAB for 12 weeks. IPGTTs of NDS groups (A) and HFDS groups (B) were conducted at 9 weeks, and IPITTs of NDS groups (C) and HFDS groups (D) were conducted at 10 weeks. Values represent the mean ± SEM; *P < 0.05, **P < 0.01, and ***P < 0.001 for comparisons between NDS or HFDS and respective LAB administration groups; #P < 0.05, ##P < 0.01, and ###P < 0.001 for comparisons between ND or HFD and NDS or HFDS groups, respectively (Student’s t test). Symbols: ×, ND (n = 3) or HFD (n = 3); ○, NDS (n = 5) or HFDS (n = 5); ■, BNR17 (108, n = 5); ▴, LRCC5310 (108, n = 5); ▾, LRCC5314 (108, n = 5).

