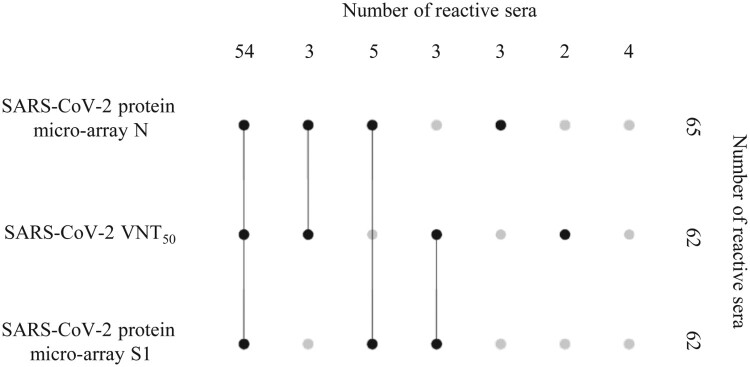
Figure 2.
UpSet plot [40] visualizing the relationships between data sets obtained with three different assays, i.e. SARS-CoV-2 micro-array S1, SARS-CoV-2 micro-array N, SARS-CoV-2 VNT50, and 74 sera from RT-PCR-confirmed SARS-CoV-2 cases that were sampled ≥21 days after onset of symptoms. Top row depicts the number of 74 serum samples that could be detected (plotted black dots) or not (plotted grey dots) in different combinations of the three assays. Column on the right side depicts how many sera of the total number of 74 sera that could be identified (black dots) or not (grey dots) using the respective individual test methods.

