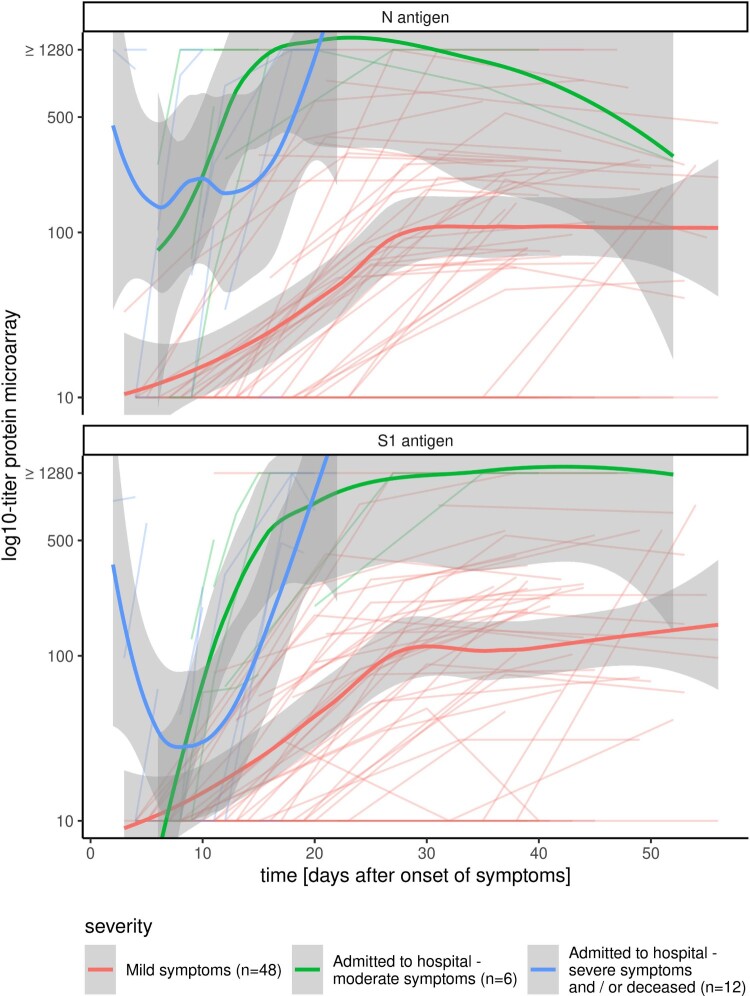
Figure 3.
SARS-CoV-2 antibody kinetics and clinical manifestation. Longitudinal micro-array titres of individual cases with varying degrees of severity of COVID-19 infection: cases with mild symptoms (red, n = 47), patients with moderate symptoms that were admitted to the hospital, but not in intensive care unit (green, n = 6), patients with severe symptoms that were admitted to the intensive care unit of the hospital and/or died to COVID-19 infection (blue, n = 12). Bold lines depict the fitted curves with the 95% confidence interval for the three disease categories.

