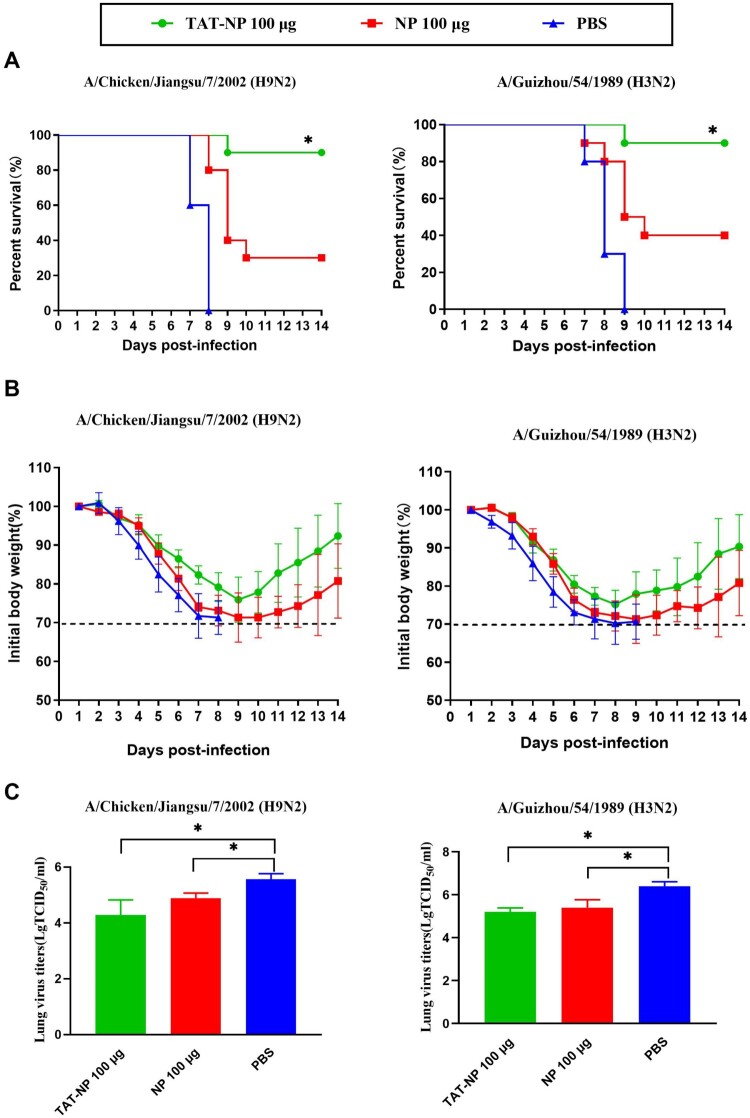
Figure 3.
Protection of vaccinated mice against challenge with H9N2 and H3N2. BALB/c mice (n = 16 per group) were immunized intranasally on day 0, 14 and 21 with NP or TAT-NP, whereas control animals received PBS. All groups were challenge on day 42 with 10 × LD50 A/Chicken/Jiangsu/7/2002 (H9N2) or A/Guizhou/54/1989 (H3N2). The survival rates (A) and body weights changes (B) of the mice (n = 10 per group) were measured daily from the date of the challenge to 14 days after the challenge. The error bars represent the SDs. The survival rates were evaluated by log-rank (Mantel–Cox) test. * indicates significant differences compared with the same dose NP group (P < 0.05). The lung virus titers (C) are expressed as mean ± SD of three tested mice in each group. The t-test was used to determine difference in viral load. * indicates significant differences (P < 0.05).

