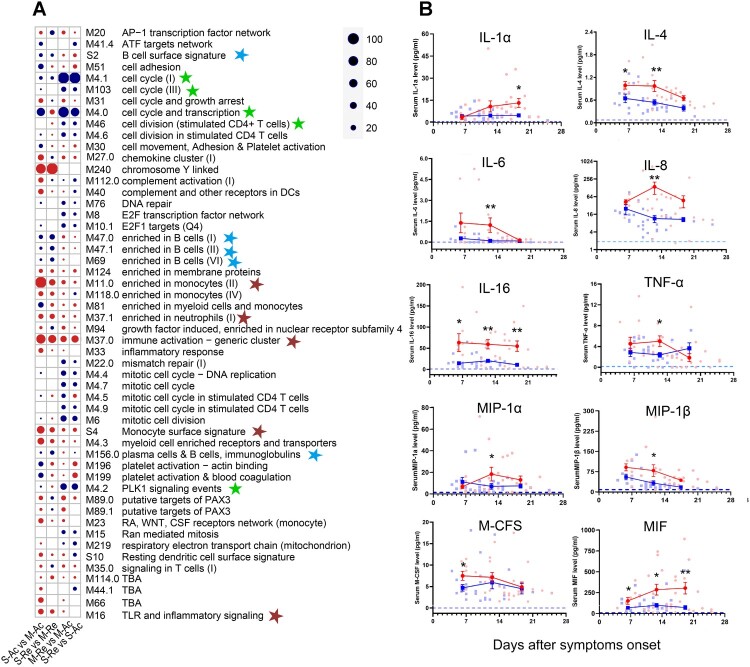
Figure 5.
Gene expression array analysis and related serum cytokine in HTNV patients. (A) The gene set analysis shows the identifiers and names of the top 20 BTM gene sets of each comparison sorted by the significance score. Red indicates positive enrichment of a gene set and blue indicates negative enrichment. Circle size is proportional to the significance score that assigns high scores to the gene sets with strong fold-changes and high statistical significance. The blue, brown and green stars represent gene sets enriched in B cells, monocytes and neutrophils, and cell cycle, respectively. S-Ac: severe cases in the acute phase; M-Ac: moderate cases in the acute phase; S-Re: severe cases in the recovery phase; M-Re: moderate cases in the recovery phase. (B) Dynamic comparison of serum cytokine concentrations in both moderate and severe groups during the 3-week period post symptom onset. Blue squares, red dots and blue dashed lines represent means of moderate, severe and health group, respectively. The mean +/- standard error is shown for each group and the P-value is determined by t-test or Kruskal–Wallis test. Statistical significance was represented by asterisk, * P < 0.05, ** P < 0.01.

