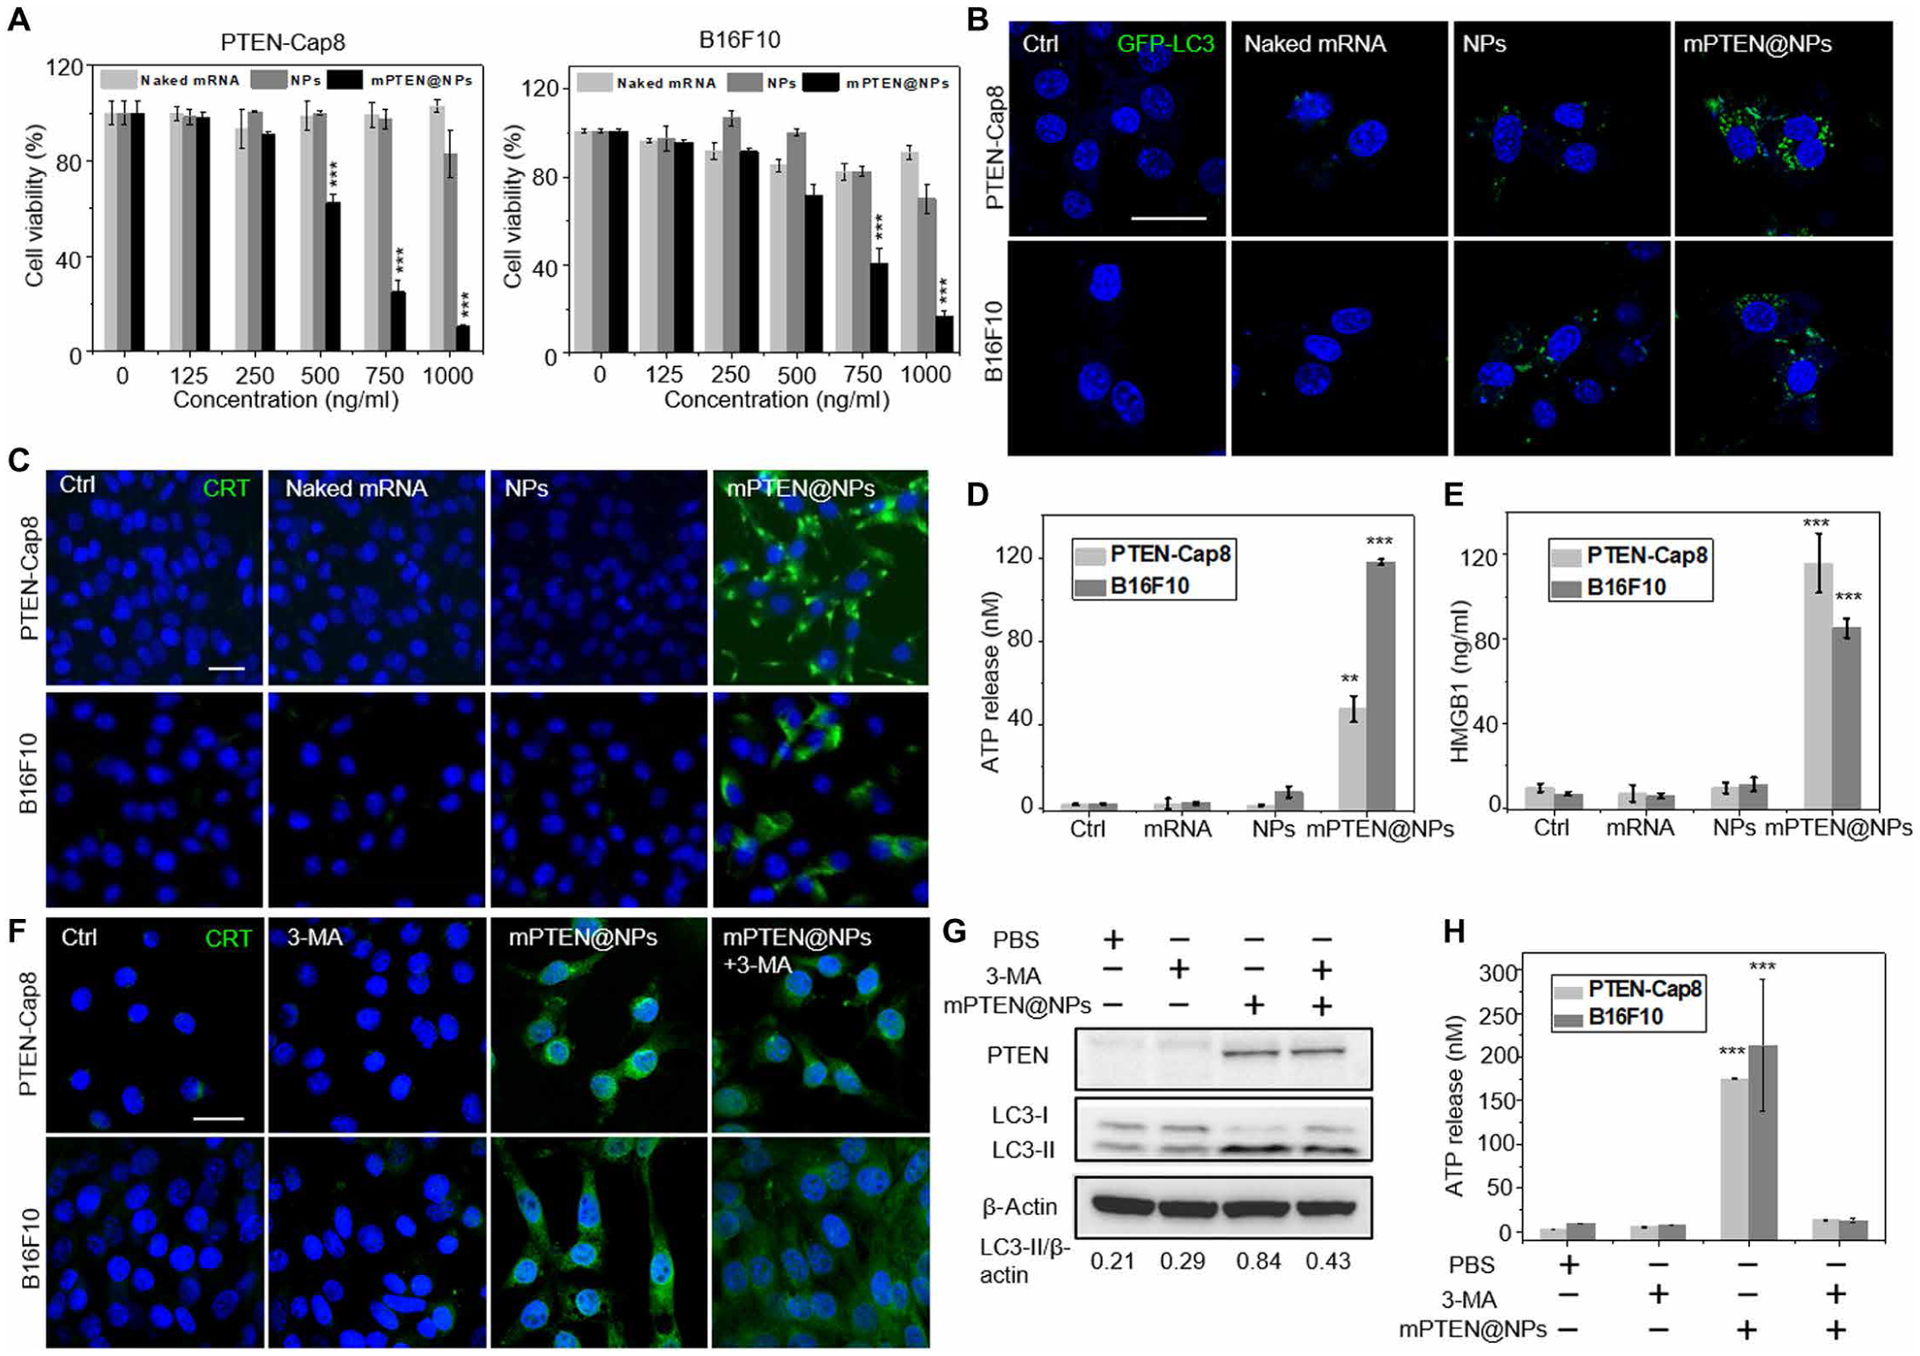
Fig. 2. mPTEN@NP treatment induces ICD of cancer cells in vitro.

(A) Cell viability of PTEN-Cap8 and B16F10 cells after treatment with mPTEN@NPs for 48 hours. Data are presented as means ± SD (n = 3 replicates). Statistical significance was calculated using a two-tailed Student’s t test, ***P < 0.001. (B) Confocal laser scanning microscopy (CLSM) imaging for cells transfected with GFP-LC3. (C to E) Analysis of ICD markers in PTEN-Cap8 and B16F10 cells after mPTEN@NPs treatment for 48 hours. (C) CRT expression on PTEN-Cap8 and B16F10 cells was evaluated by CLSM. ATP release (D) and HMGB1 release (E) were evaluated by ELISA. (F) CRT expression was assessed by CLSM on PTEN-Cap8 and B16F10 cells that were cotreated with mPTEN@NPs and the autophagy inhibitor, 3-MA. (G) Western blot analysis for PTEN and LC3-II expressions when cotreated with mPTEN@NPs and 3-MA for 48 hours. Bottom: The quantitative analysis results for LC3-II expression that performed on LC3-II protein bands intensities at each condition were normalized with β-actin. (H) ATP release after treatment with mPTEN@NPs and 3-MA for 48 hours was evaluated by ELISA. Data in (D), (E), and (H) are presented as means ± SD (n = 3 replicates per group) and were calculated via one-way ANOVA with a Tukey post hoc test. **P < 0.01 and ***P < 0.001. Scale bars, 20 μm.
