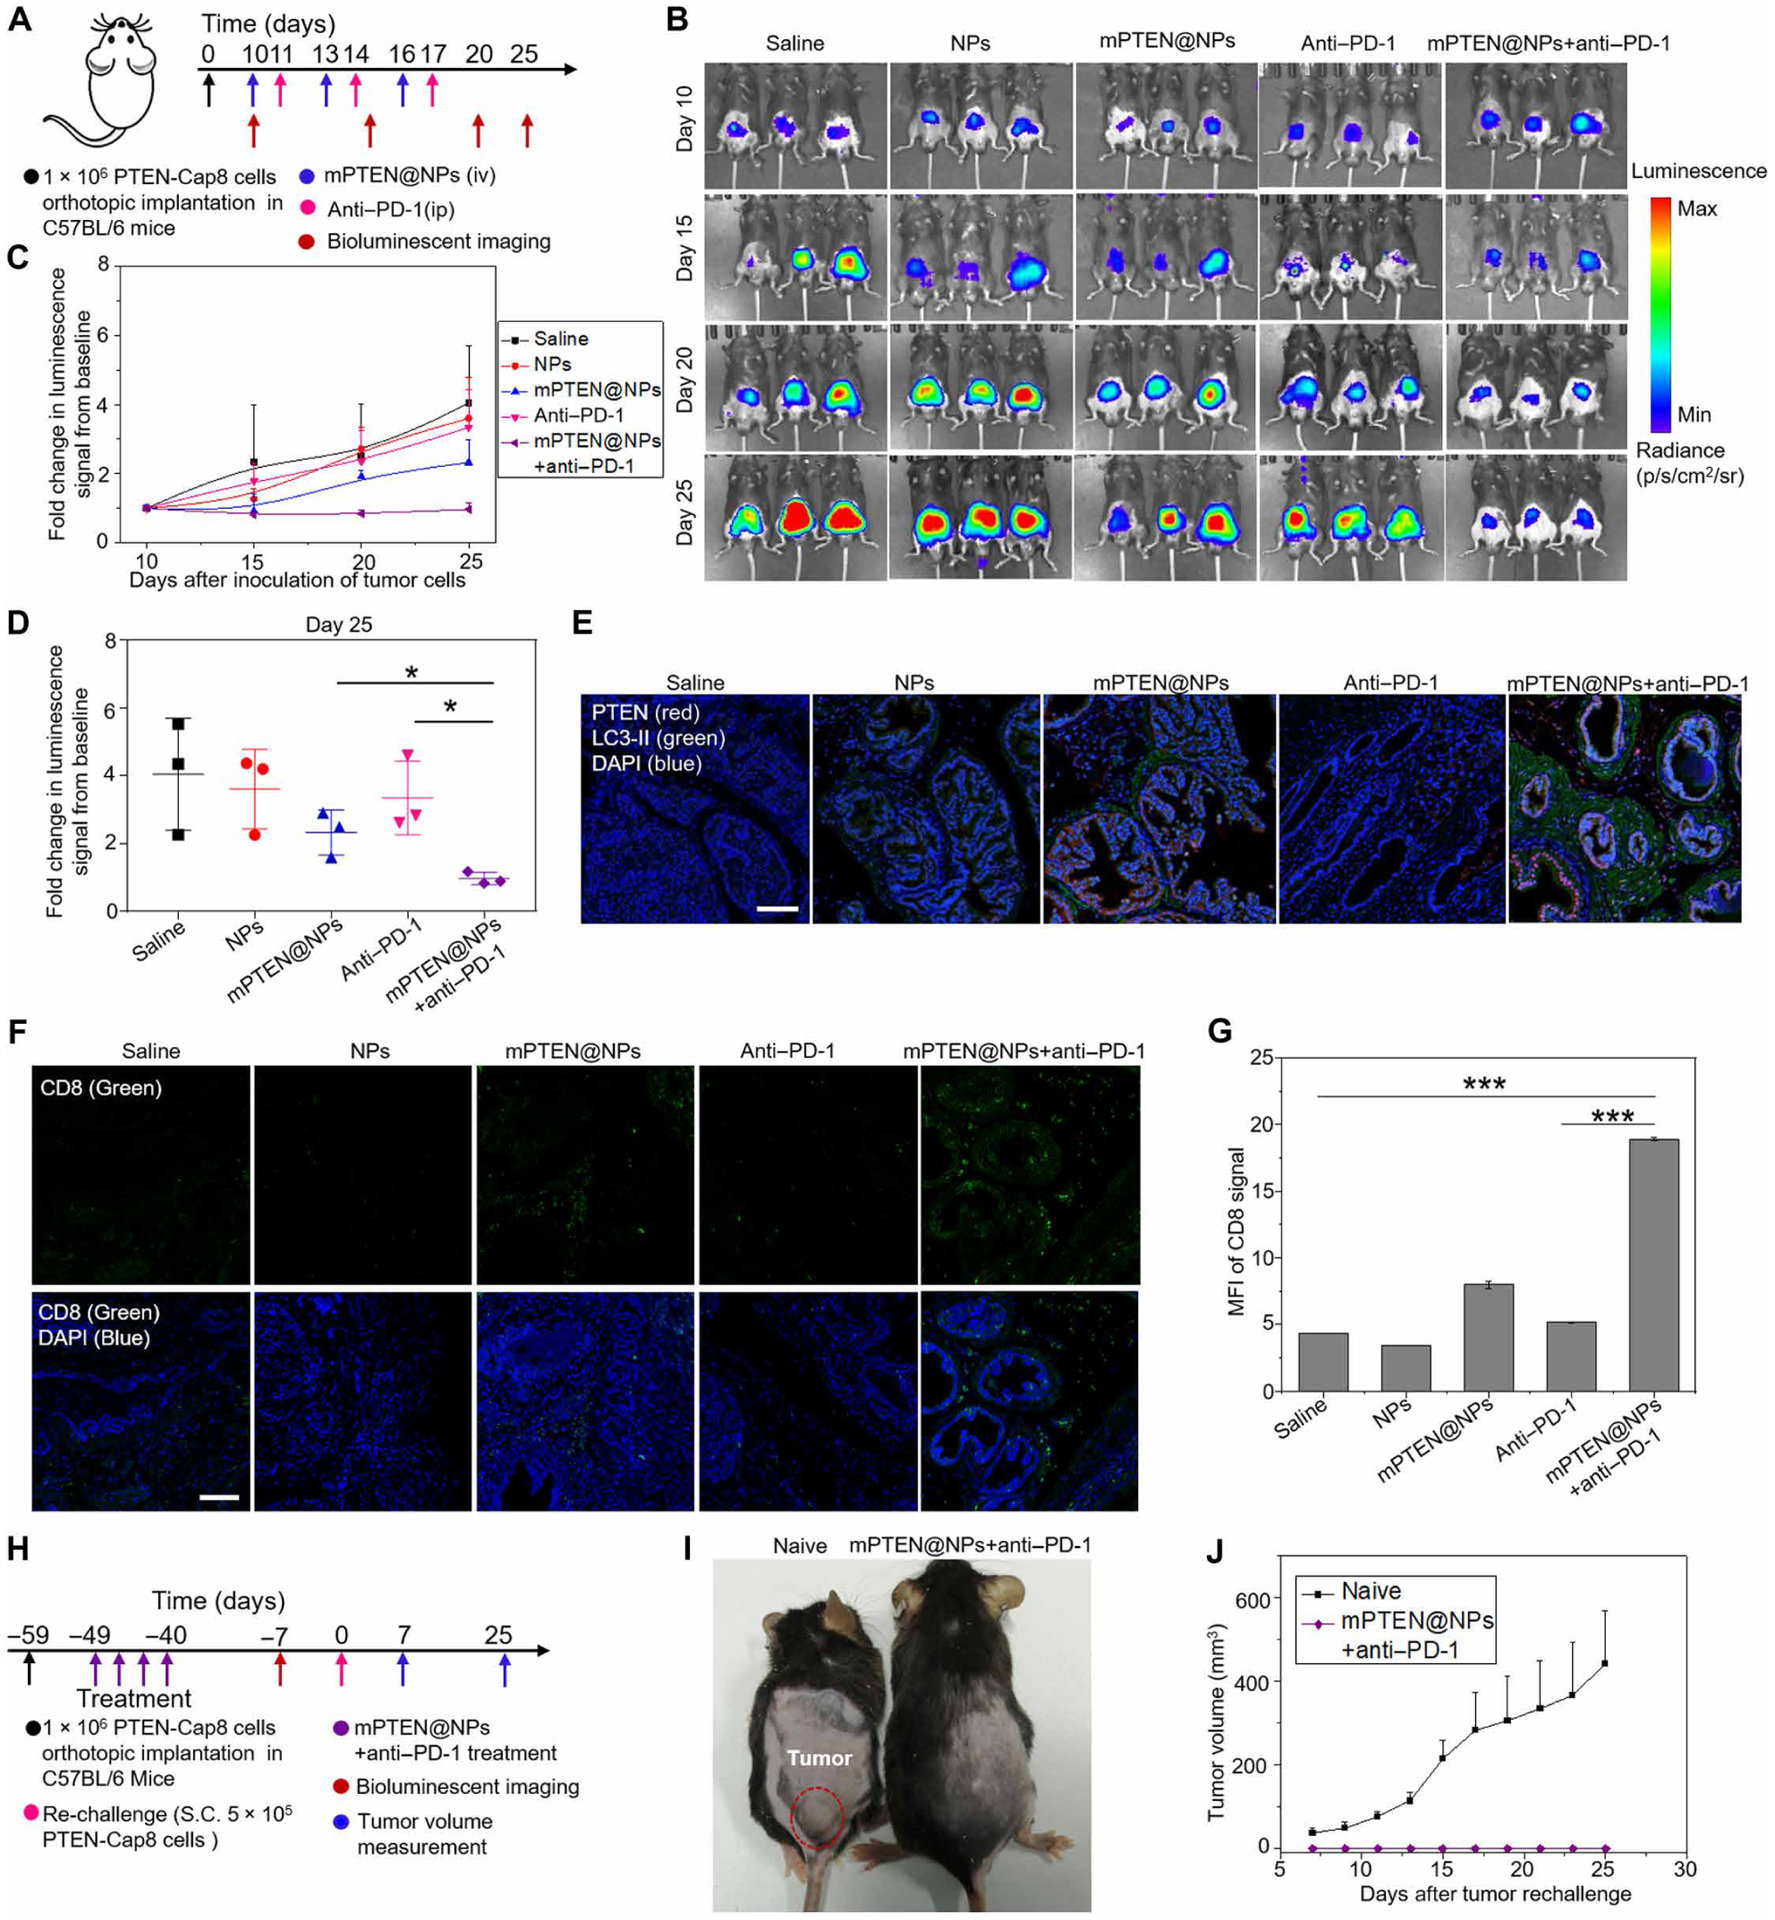
Fig. 5. Therapeutic efficacy and immunological memory of mPTEN@NPs with anti–PD-1 in the orthotopic mouse model of Pten-null prostate cancer.

(A) Experimental timeline for treatment of Pten-null orthotopic prostate tumor–bearing mice. (B) In vivo bioluminescence imaging of Pten-null orthotopic prostate tumors from mice treated as indicated. Tumor imaging was obtained every 5 days from the initial treatment day (day 10 after tumor inoculation) until day 25. (C) The fold change in bioluminescence signals from baseline at day 10 of PTEN-Cap8-Luc tumors. (D) Quantitative analysis of the fold change in bioluminescence signals from baseline of PTEN-Cap8-Luc tumors at day 25. Data in (C) and (D) are presented as means ± SD (n = 3 mice per group). Statistical significance was calculated via one-way ANOVA with a Tukey post hoc test. *P < 0.05. (E) Immunofluorescence staining of tumors for PTEN (red) and LC3-II (green) expression at day 25 after the indicated treatments. Scale bar, 100 μm. (F) Immunofluorescence staining of tumors for CD8+ T cell infiltration (green) at day 25 after the indicated treatments. Scale bar, 100 μm. (G) Quantitative analysis of mean fluorescent intensity from (F). Data are presented as means ± SD (n = 3 mice per group). Statistical significance was calculated via one-way ANOVA with a Tukey post hoc test. ***P < 0.001. (H) Experimental timeline for treatment of Pten-null orthotopic prostate tumor–bearing mice and S.C. rechallenge. In the naive group, C57BL/6 mice were subcutaneously implanted with PTEN-Cap8 cells at day 0 without any pretreatment. (I) Representative photograph of mice from the naive group and the combination treatment group at day 25. Note that the mice in the naive group are about 7 to 8 weeks younger than those in the combination treatment group. (J) The subcutaneous tumor growth profile for the naive group and the combination treatment group (mPTEN@NPs + anti–PD-1). Data are presented as means ± SEM (n = 4 mice per group).
