
Figure 2.
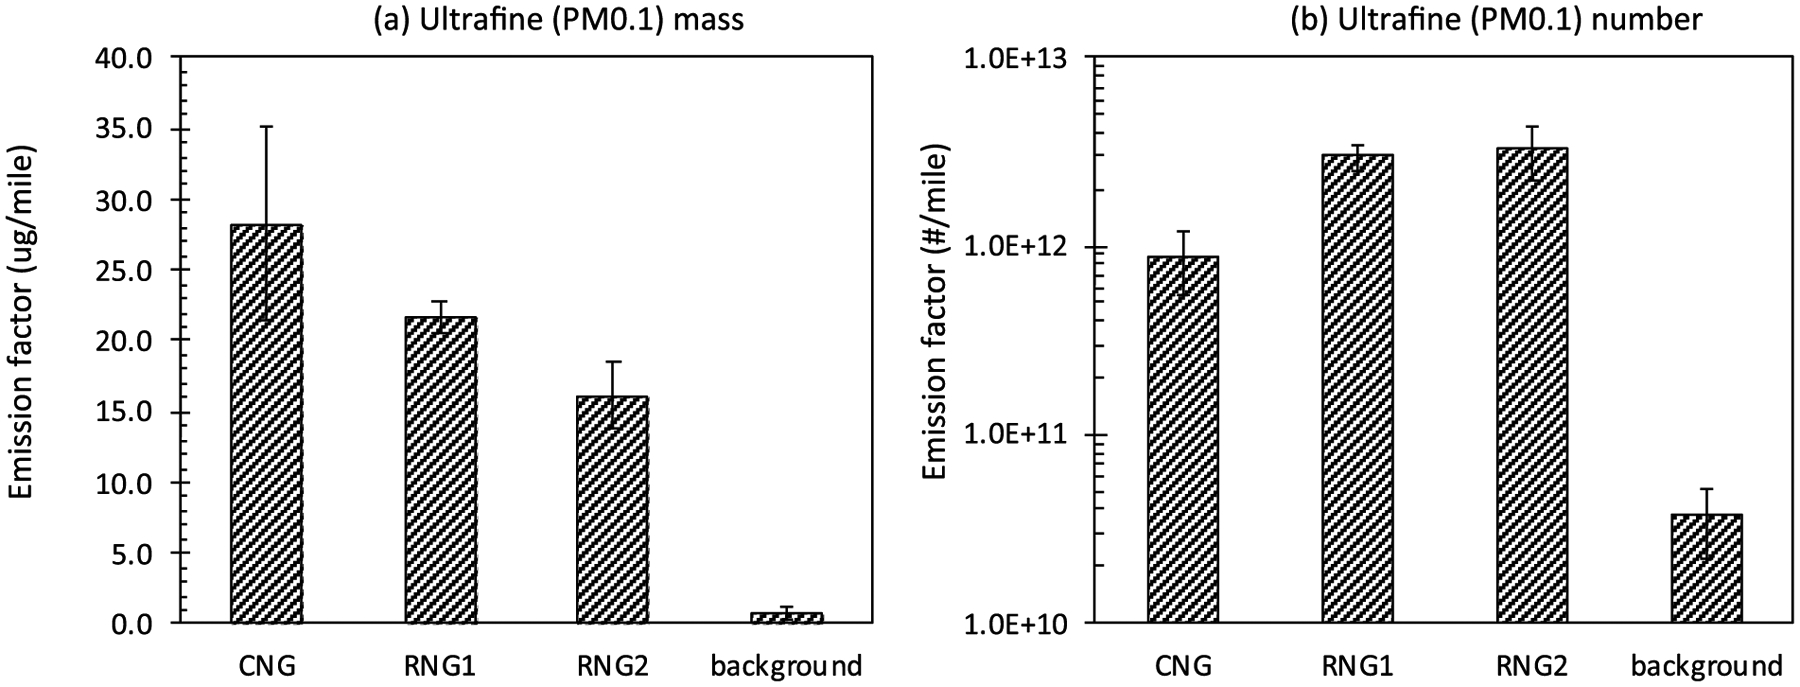
UC cycle-averaged emission factor of ultrafine particle (PM0.1): (a) mass (μg·mile−1) and (b) number (#·mile−1) from the tested vehicle running on different fuels. The height of the bars represents the average value of total PM mass or number emission factor calculated from EEPS measurement (only including 6.4–93.1 nm) of the duplicate tests on the same fuel. Error bars represent the min and max values from the duplicate tests on the same fuel.