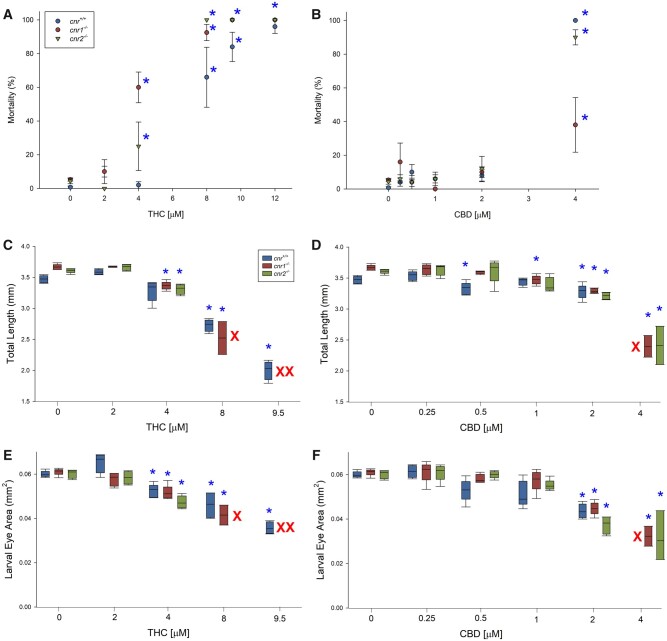
Figure 3.
Mortality (%), total length (mm), and larval eye area (mm2) of 96 hpf larval zebrafish developmentally exposed to Δ9-tetrahydrocannabinol (A, C, E) or cannabidiol (B, D, F) presented as box and whisker plots (n = 5). Asterisk indicates a significant difference compared with the within-strain solvent control (ANOVA, Dunnett’s posthoc, p ≤ .05). Red X’s indicate concentration/strains with no survival.

