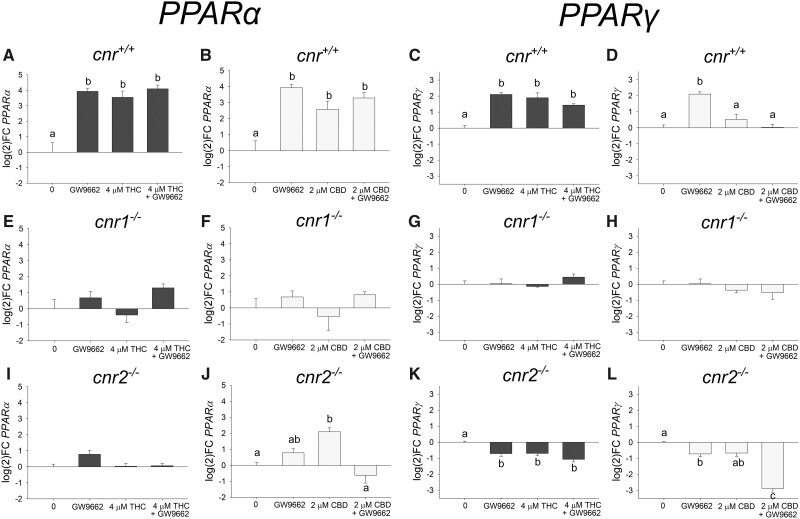
Figure 6.
Expression log(2)fold change of PPARα (A:J) and PPARγ (C:L) of 96 hpf larval zebrafish developmentally exposed (6 − 96 hpf) to THC, CBD, GW9662 (PPARγ antagonist), or a mixture (n = 3 − 5). Different letters indicate a significant difference between groups (ANOVA, Tukey’s posthoc, p ≤ .05).

