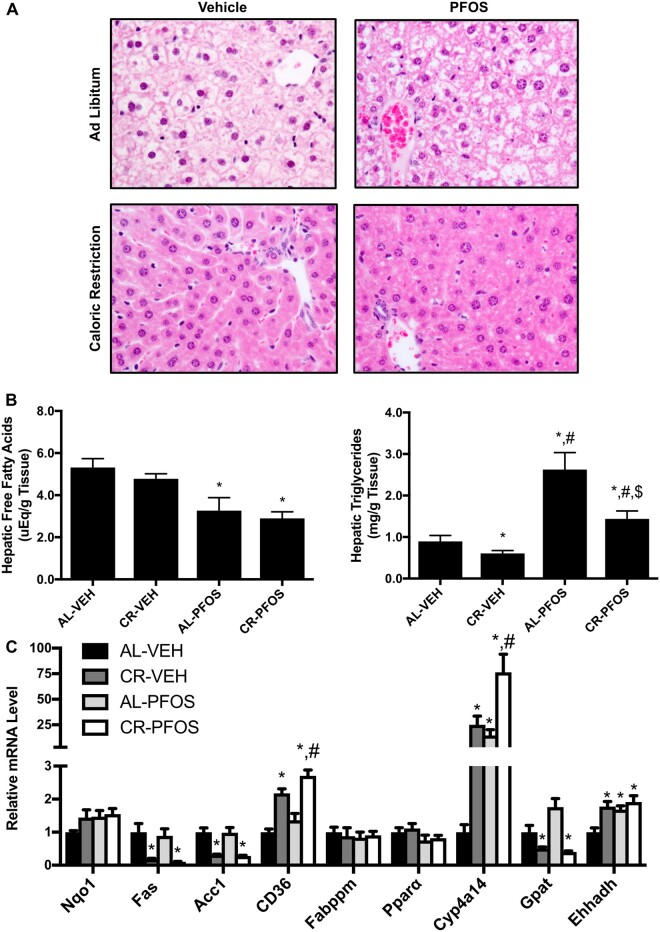
Figure 3.
PFOS significantly increased hepatic lipid content. A, Liver histopathology. H&E staining of liver tissue illustrates PFOS administration increased vacuolization in mice that underwent CR compared with AL feeding. Vacuoles were visualized in AL-PFOS and CR-PFOS livers, which were consistent with histopathology described for other perfluorinated chemicals (Filgo et al., 2015; Wu et al., 2019). Liver lipids were isolated and quantified via colorimetric assays. B, PFOS decreased free fatty acid (FFA) concentration in livers of AL and CR mice. C, PFOS increased liver triglyceride concentrations in AL and CR mice. D, Relative mRNA expression in liver in response to CR and PFOS treatment. Cluster of differentiation 36 (CD36), a fatty acid translocase, and Cyp4a14 were higher in CR-PFOS than CR-Veh mice. Asterisks (*) represent a statistical difference in treatments compared with controls, and # represents a significant difference between CR-Veh versus CR-PFOS (p < .05).

