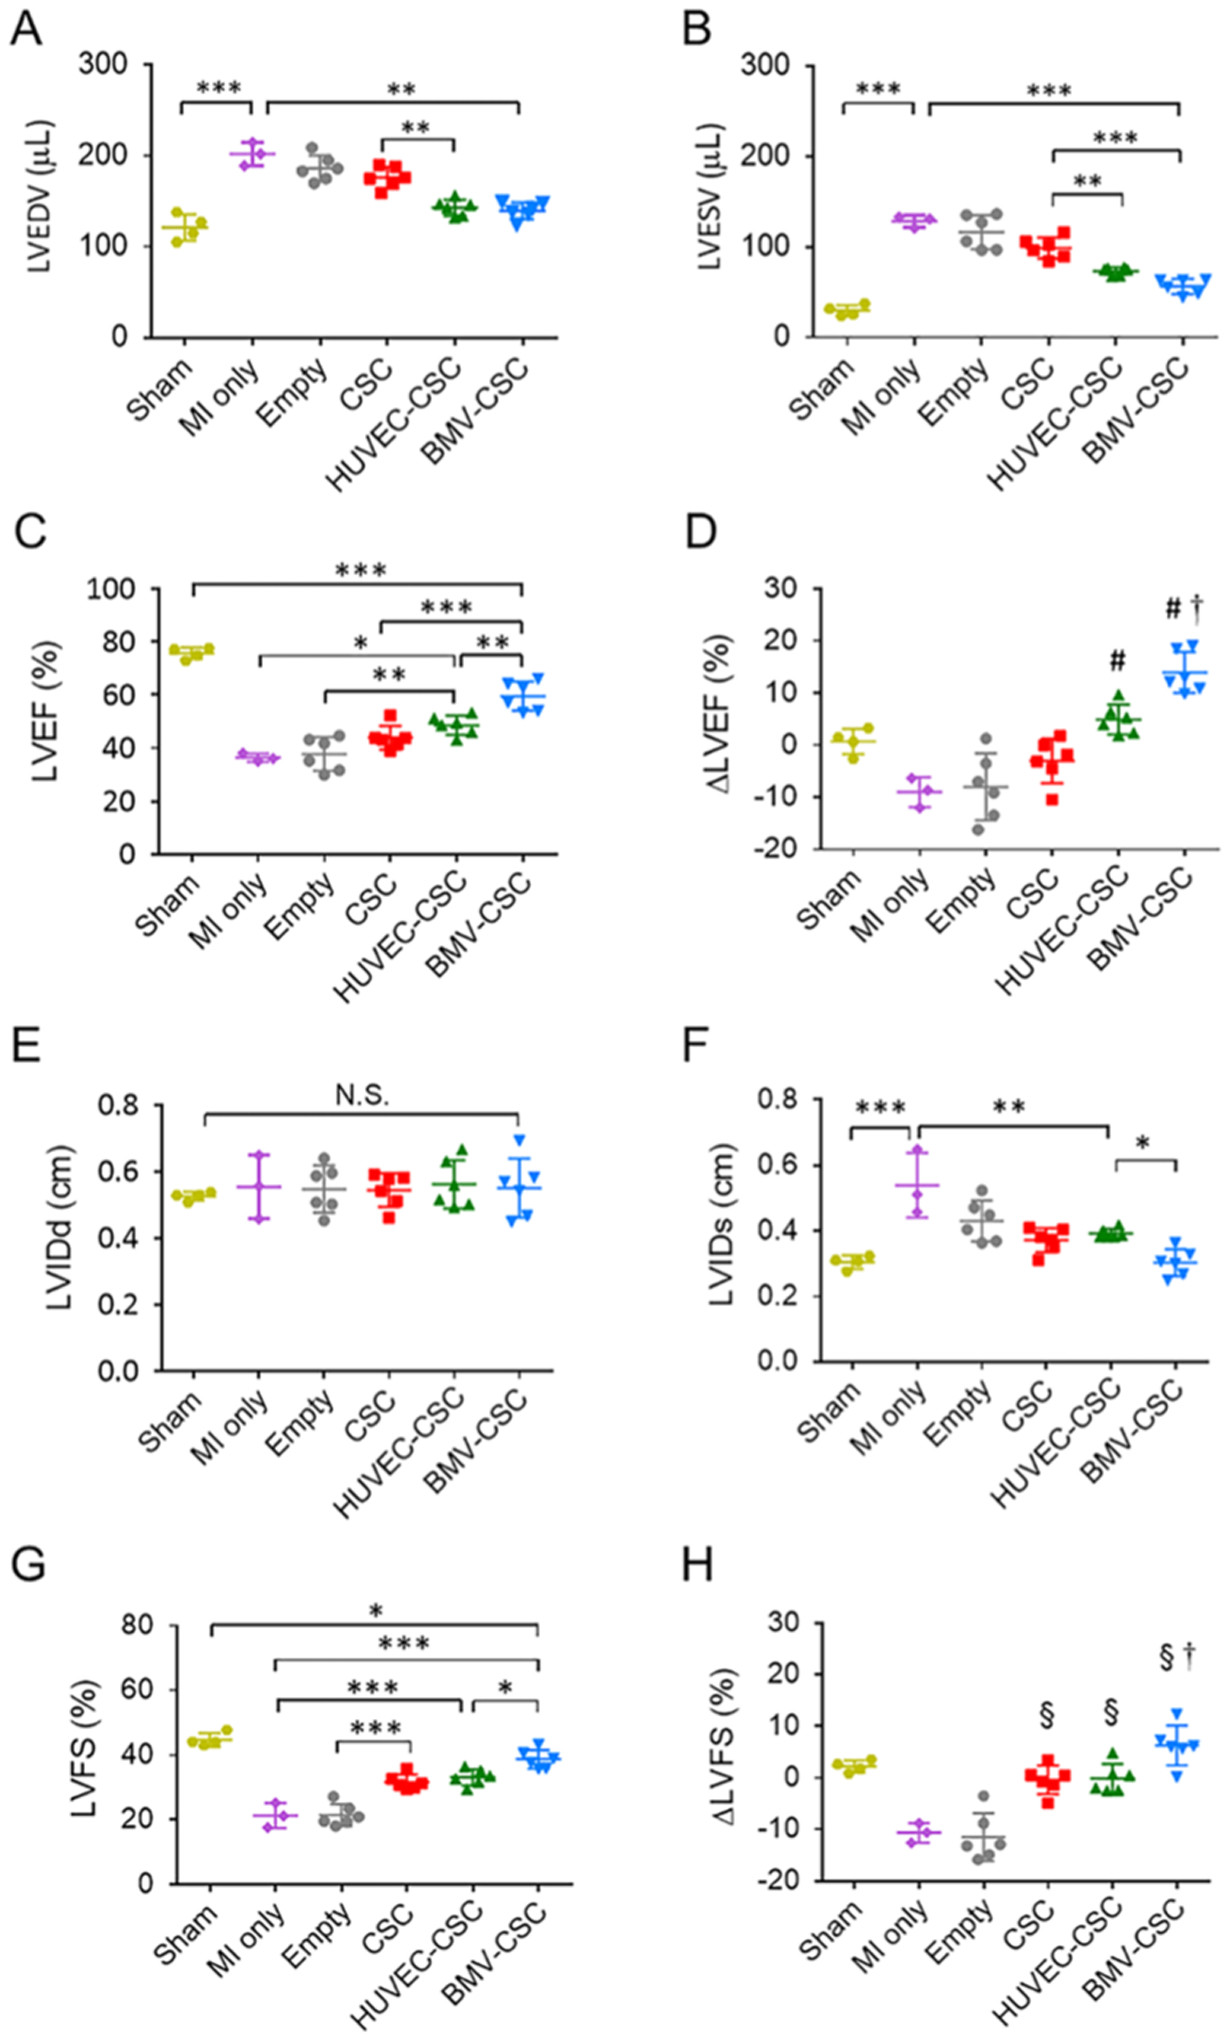
Figure 3.

BMV–CSC patch therapy improved cardiac function following acute MI. Echocardiographic assessment of (A) LVEDV, (B) LVESV, and (C) LVEF at the 4-week end point in rats that received different treatments. (D) LVEF change between the 4-week end point and the baseline. # denotes a p-value less than 0.05 when compared to MI-only, empty patch, or CSC patch group; † denotes a p-value less than 0.05 when compared to all other groups. (E) LVIDd, (F) LVIDs, and (G) LVFS measured by echocardiography at the 4-week end point in rats that received different treatments. (H) LVFS change at the 4-week end point relative to the baseline. § denotes a p-value of less than 0.05 when compared to the MI-only or empty patch group; † denotes a p-value of less than 0.05 when compared to all other groups.
