
Fig. 2. Metabolic evolution leads to acquired resistance with no obvious growth defect.
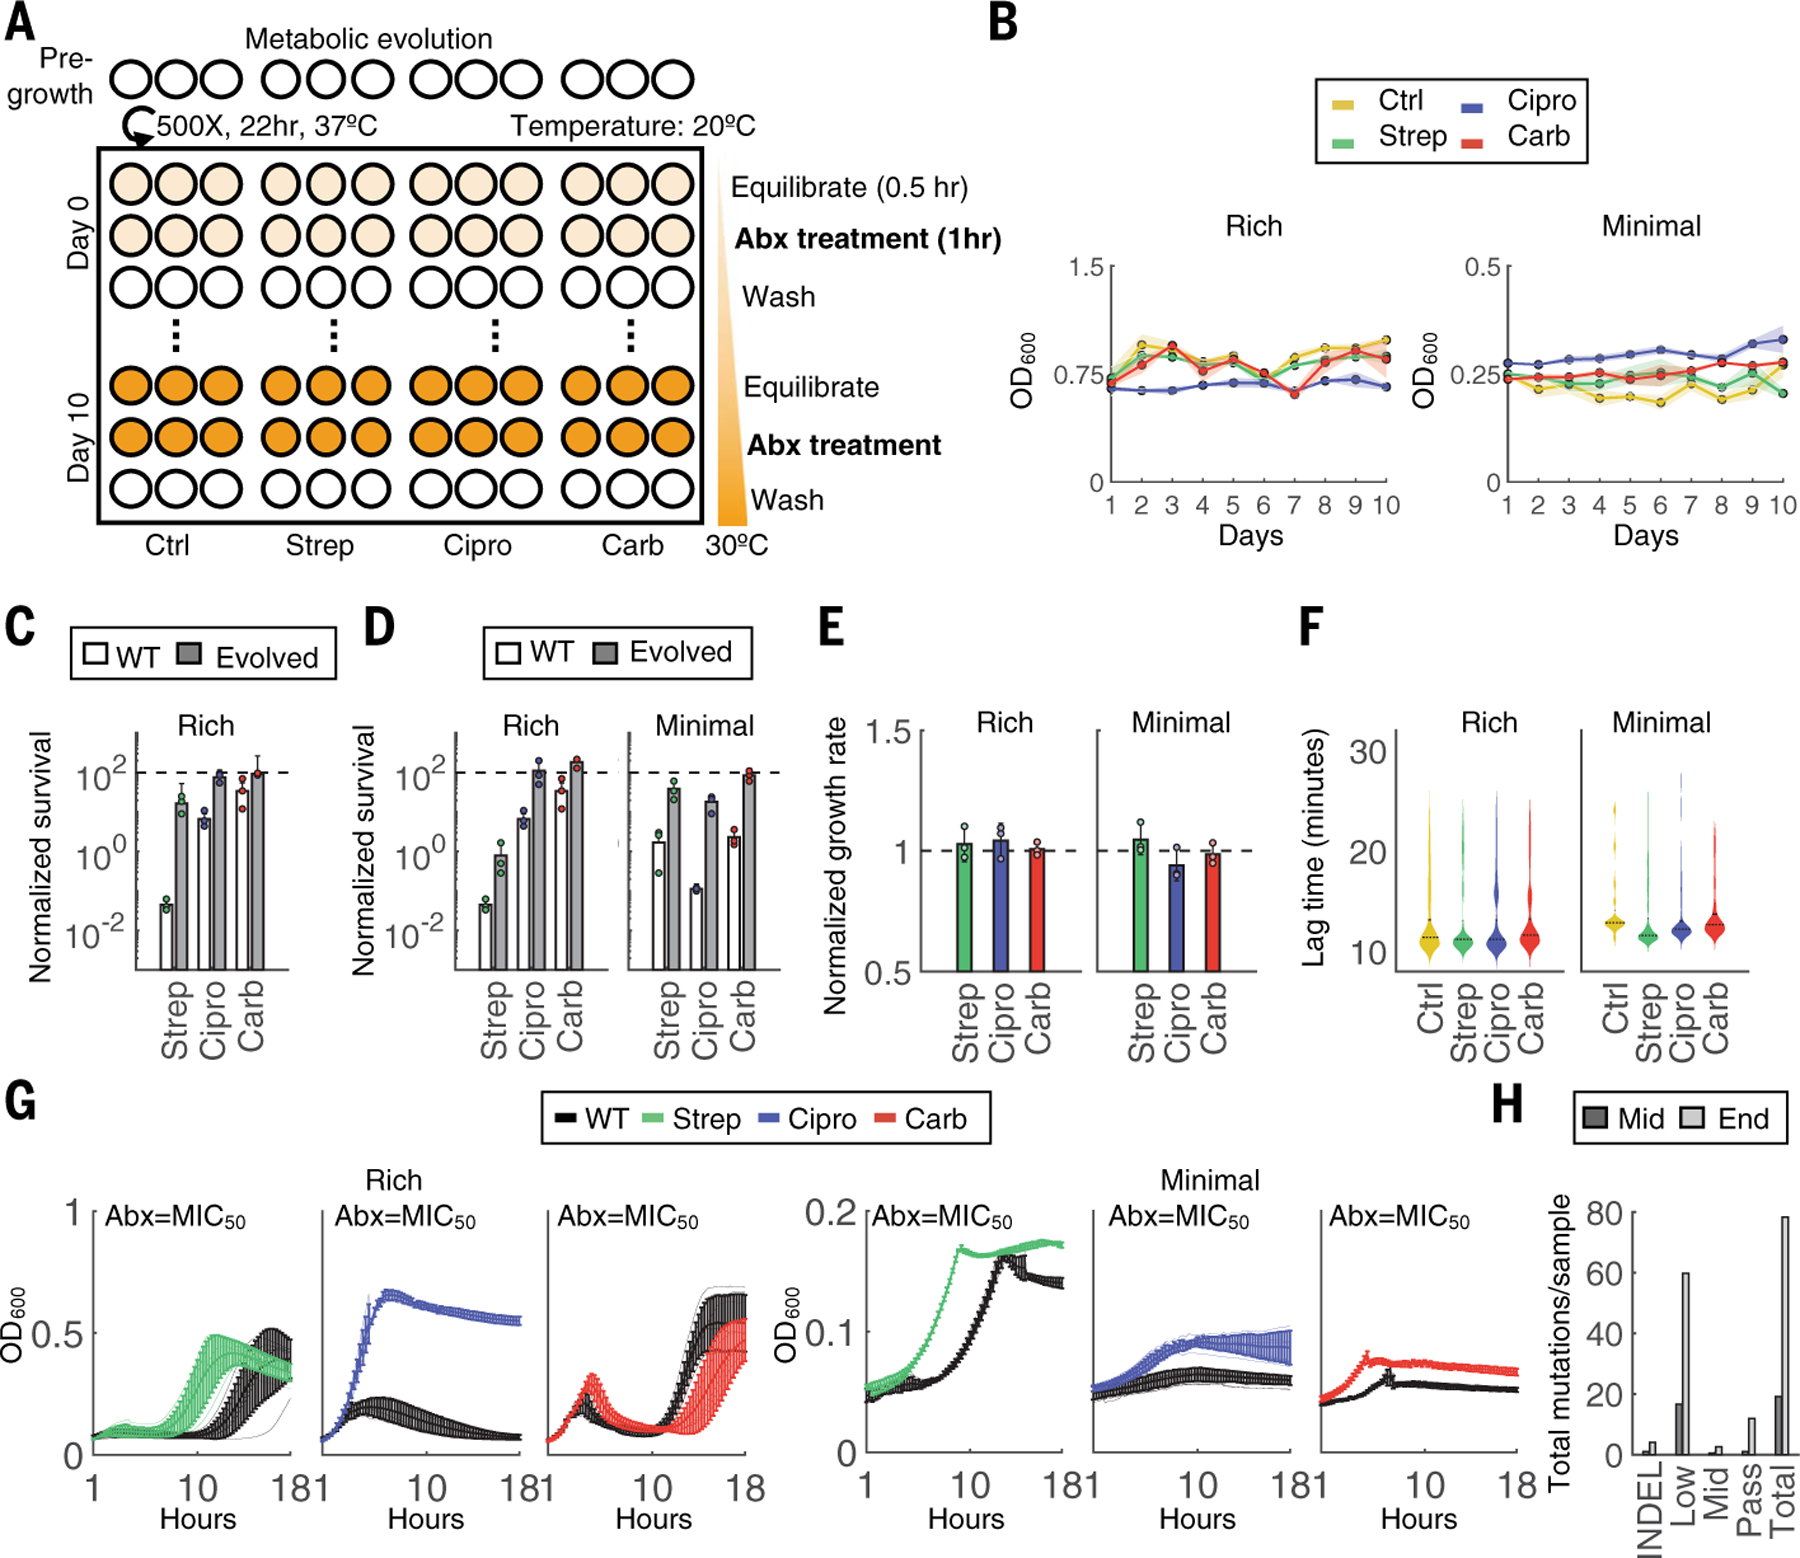
(A) Evolution schematic. Triplicate populations were treated with no antibiotic, strep, carb, or Cipro for a total of 11 days at 40× MIC50 for 1 hour at increasing metabolic states. Thirty minutes before antibiotic treatment, cells were equilibrated to a temperature that increased daily in 1°C increments beginning on day 0 at 20°C and concluding on day 10 at 30°C. After antibiotic treatment, cells were washed 2× in PBS and grown analogously to the classic evolution. (B) OD600 measurements were obtained before daily dilutions and are shown for both rich medium (left) and minimal medium with 0.04% glucose (right) conditions. (C) Survival over the 1-hour treatment for the WT compared with terminal populations evolved through the classic evolution protocol. All experiments were performed at 30°C. Bars represent average of three biological replicates, and error bars indicate SD. (D) Survival over the 1-hour treatment for the WT compared with terminal populations evolved through the metabolic evolution protocol for rich medium (left) and minimal medium (right) conditions. All experiments were performed at 30°C. Bars represent average of three biological replicates, and error bars indicate SD. (E) Growth rates of each terminal population from rich medium (left) and minimal medium (right) conditions. One population per treatment group was tested in three independent biological replicates. Results are normalized to the untreated control (black dashed line). Bars represent the average of three biological replicates, and error bars indicate SD. (F) Lag times of individual clones evolved in either rich medium (left) or minimal medium (right). Lag times were calculated analogously to ScanLag. At least 65 clones were measured for each condition. Violin plots are shown for each distribution; black dotted line indicates the median, and solid line is the mean of the samples. (G) Growth rates for populations evolved in either rich medium (left) or minimal medium (right). OD600 (y-axis) is shown over time in hours (x-axis) obtained at intervals of 15 min for 18 hours. Lines are the average of three biological replicates, and error bars are the SD. Black lines are the WT strain. (H) Mutations summary. Mutations include indels and SNPs at frequencies determined by Pilon (passing >~90%; midlevel ~25 to 90%; low ~0.2 to 25%). SNPs per sample are summed across all samples at each time point.