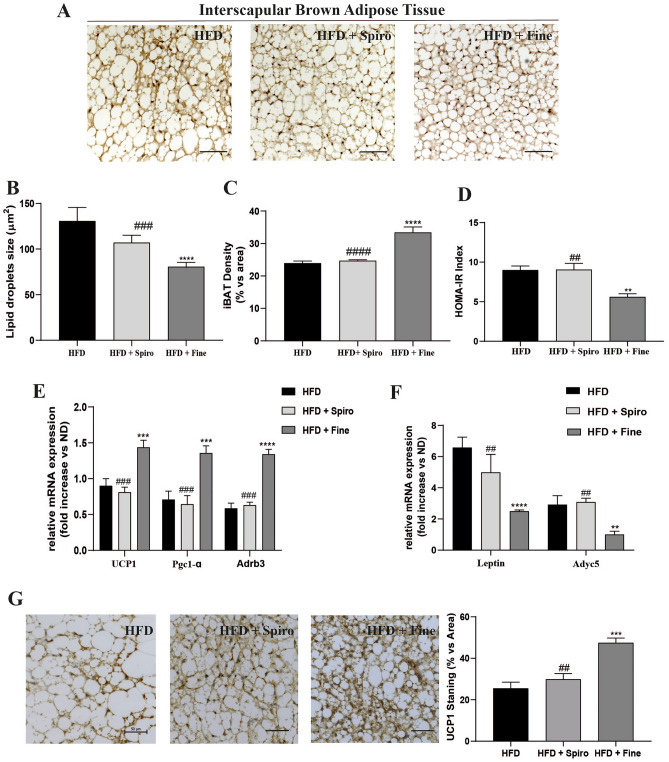
Fig. 1.
Comparison between Spironolactone and Finerenone effects on iBAT depots of HFD-fed mice (A); H&E staining of iBAT. Representative sections (scale bar 50 μm) from iBAT of all groups of mice (n = 6) (B); histological analysis of mean lipid droplets area (n = 6) (C); histological analysis of iBAT relative density (n = 6) (D); HOMA-IR index analysis (serum fasting glucose concentration (mg/ 100 ml) × serum fasting insulin concentration (mUI/L) / 405 (n = 6) (E); qRT-PCR analysis of brown-fat-selective genes in iBAT (n = 10) (F); qRT-PCR analysis of white-fat-selective genes in iBAT (n = 10) (G) UCP-1 immunostaining on iBAT. Representative sections from iBAT of all groups (n = 6). Positive area (UCP-1 staining) were selected and quantified by Image Pro Premier software. The quantification represents the average for six fields of each animal observed under 20-fold magnification. Scale bar = 50 µm **P < 0.01, ***P < 0.001, ****P < 0.0001 vs HFD; ##P < 0.01, ###P < 0.001, ####P < 0.0001 vs HFD + Fine

