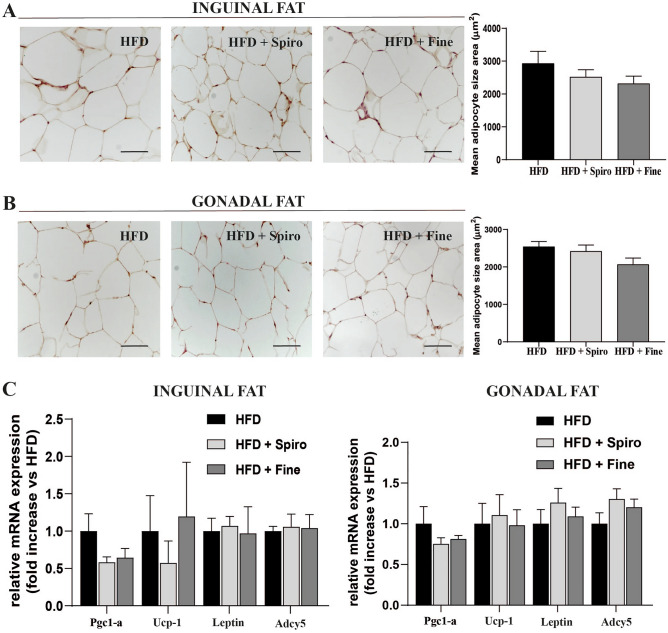
Fig. 2.
Comparison between Spironolactone and Finerenone effects on WAT morphology of HFD-fed mice (A); H&E staining on inguinal fat depots. Representative sections from inguinal fat depots of all groups of mice (n = 6, scale bar 50 μm) and histological analysis of mean adipose cell size (B); H&E staining on gonadal fat depots. Representative sections from gonadal fat depots of all groups (n = 6, scale bar 50 μm) and histological analysis of mean adipose cell size (C); qRT-PCR analysis of white fat- and brown fat-specific genes in inguinal and gonadal fat depots (n = 10)

