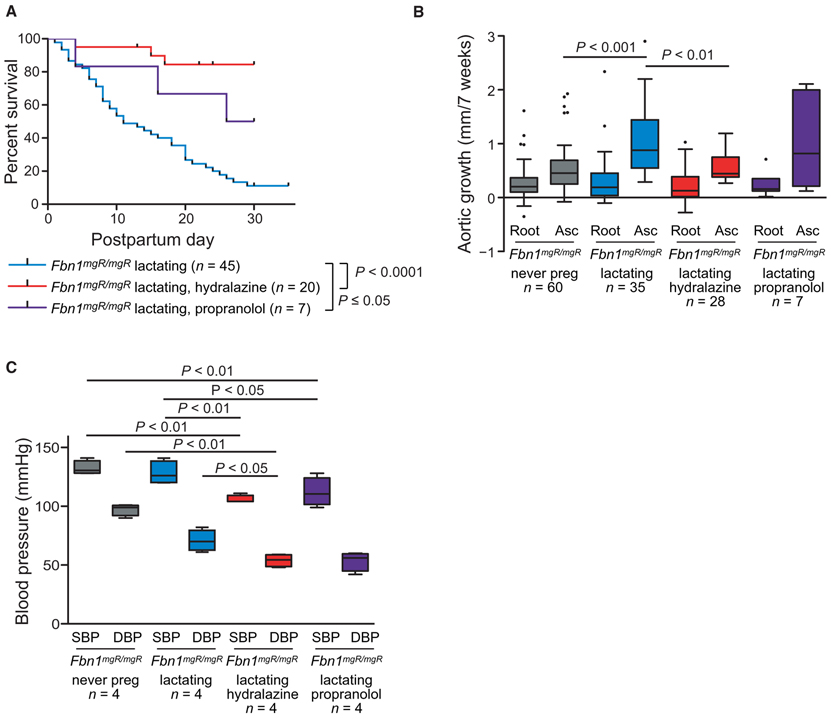
Fig. 3. Therapeutic effect of antihypertensive therapy in pregnancy.
(A) Kaplan-Meier survival curve comparing the effects of propranolol treatment (n = 7) versus hydralazine treatment (n = 20) in Fbn1mgR/mgR mice. Treatment with propranolol or hydralazine was initiated at the beginning of the third week of pregnancy and continued through the 4 weeks of lactation. (B) Average aortic root and ascending aortic growth over the 7-week period spanning pregnancy and lactation, as measured by echocardiogram, in never-pregnant (n = 60) versus lactating Fbn1mgR/mgR mice treated with placebo (n = 35), hydralazine (n = 28), or propranolol (n = 7). (C) Average systolic and diastolic blood pressure in never-pregnant and in lactating placebo-, hydralazine-, and propranolol-treated Fbn1mgR/mgR mice (n = 4 for each treatment group). Survival was statistically evaluated using a log-rank (Mantel-Cox) test. When data are presented as boxplots, the box extends from the 25th to 75th percentiles, median is denoted by the internal line, and whiskers indicate the range calculated using the Tukey method, with data points outside the whiskers shown as individual points. All significant P values (P < 0.05) are noted in the figure.

