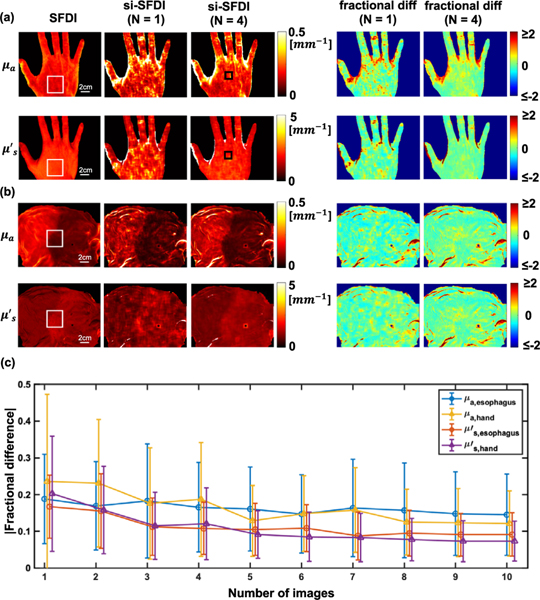
Fig. 3.
Comparison of one- and four-image si-SFDI optical property estimates with SFDI ground truth in (a) in vivo human hand, and (b) ex vivo pig gastroesophageal junction. N indicates the number of input patterns. (c) Absolute percentage difference as a function of number of speckle patterns used in the si-SFDI calculation for the ROI indicated by the white boxes in (a) and (b). Error bars are standard deviations. Black boxes in (a) highlight a scar that did not produce contrast in SFDI.

