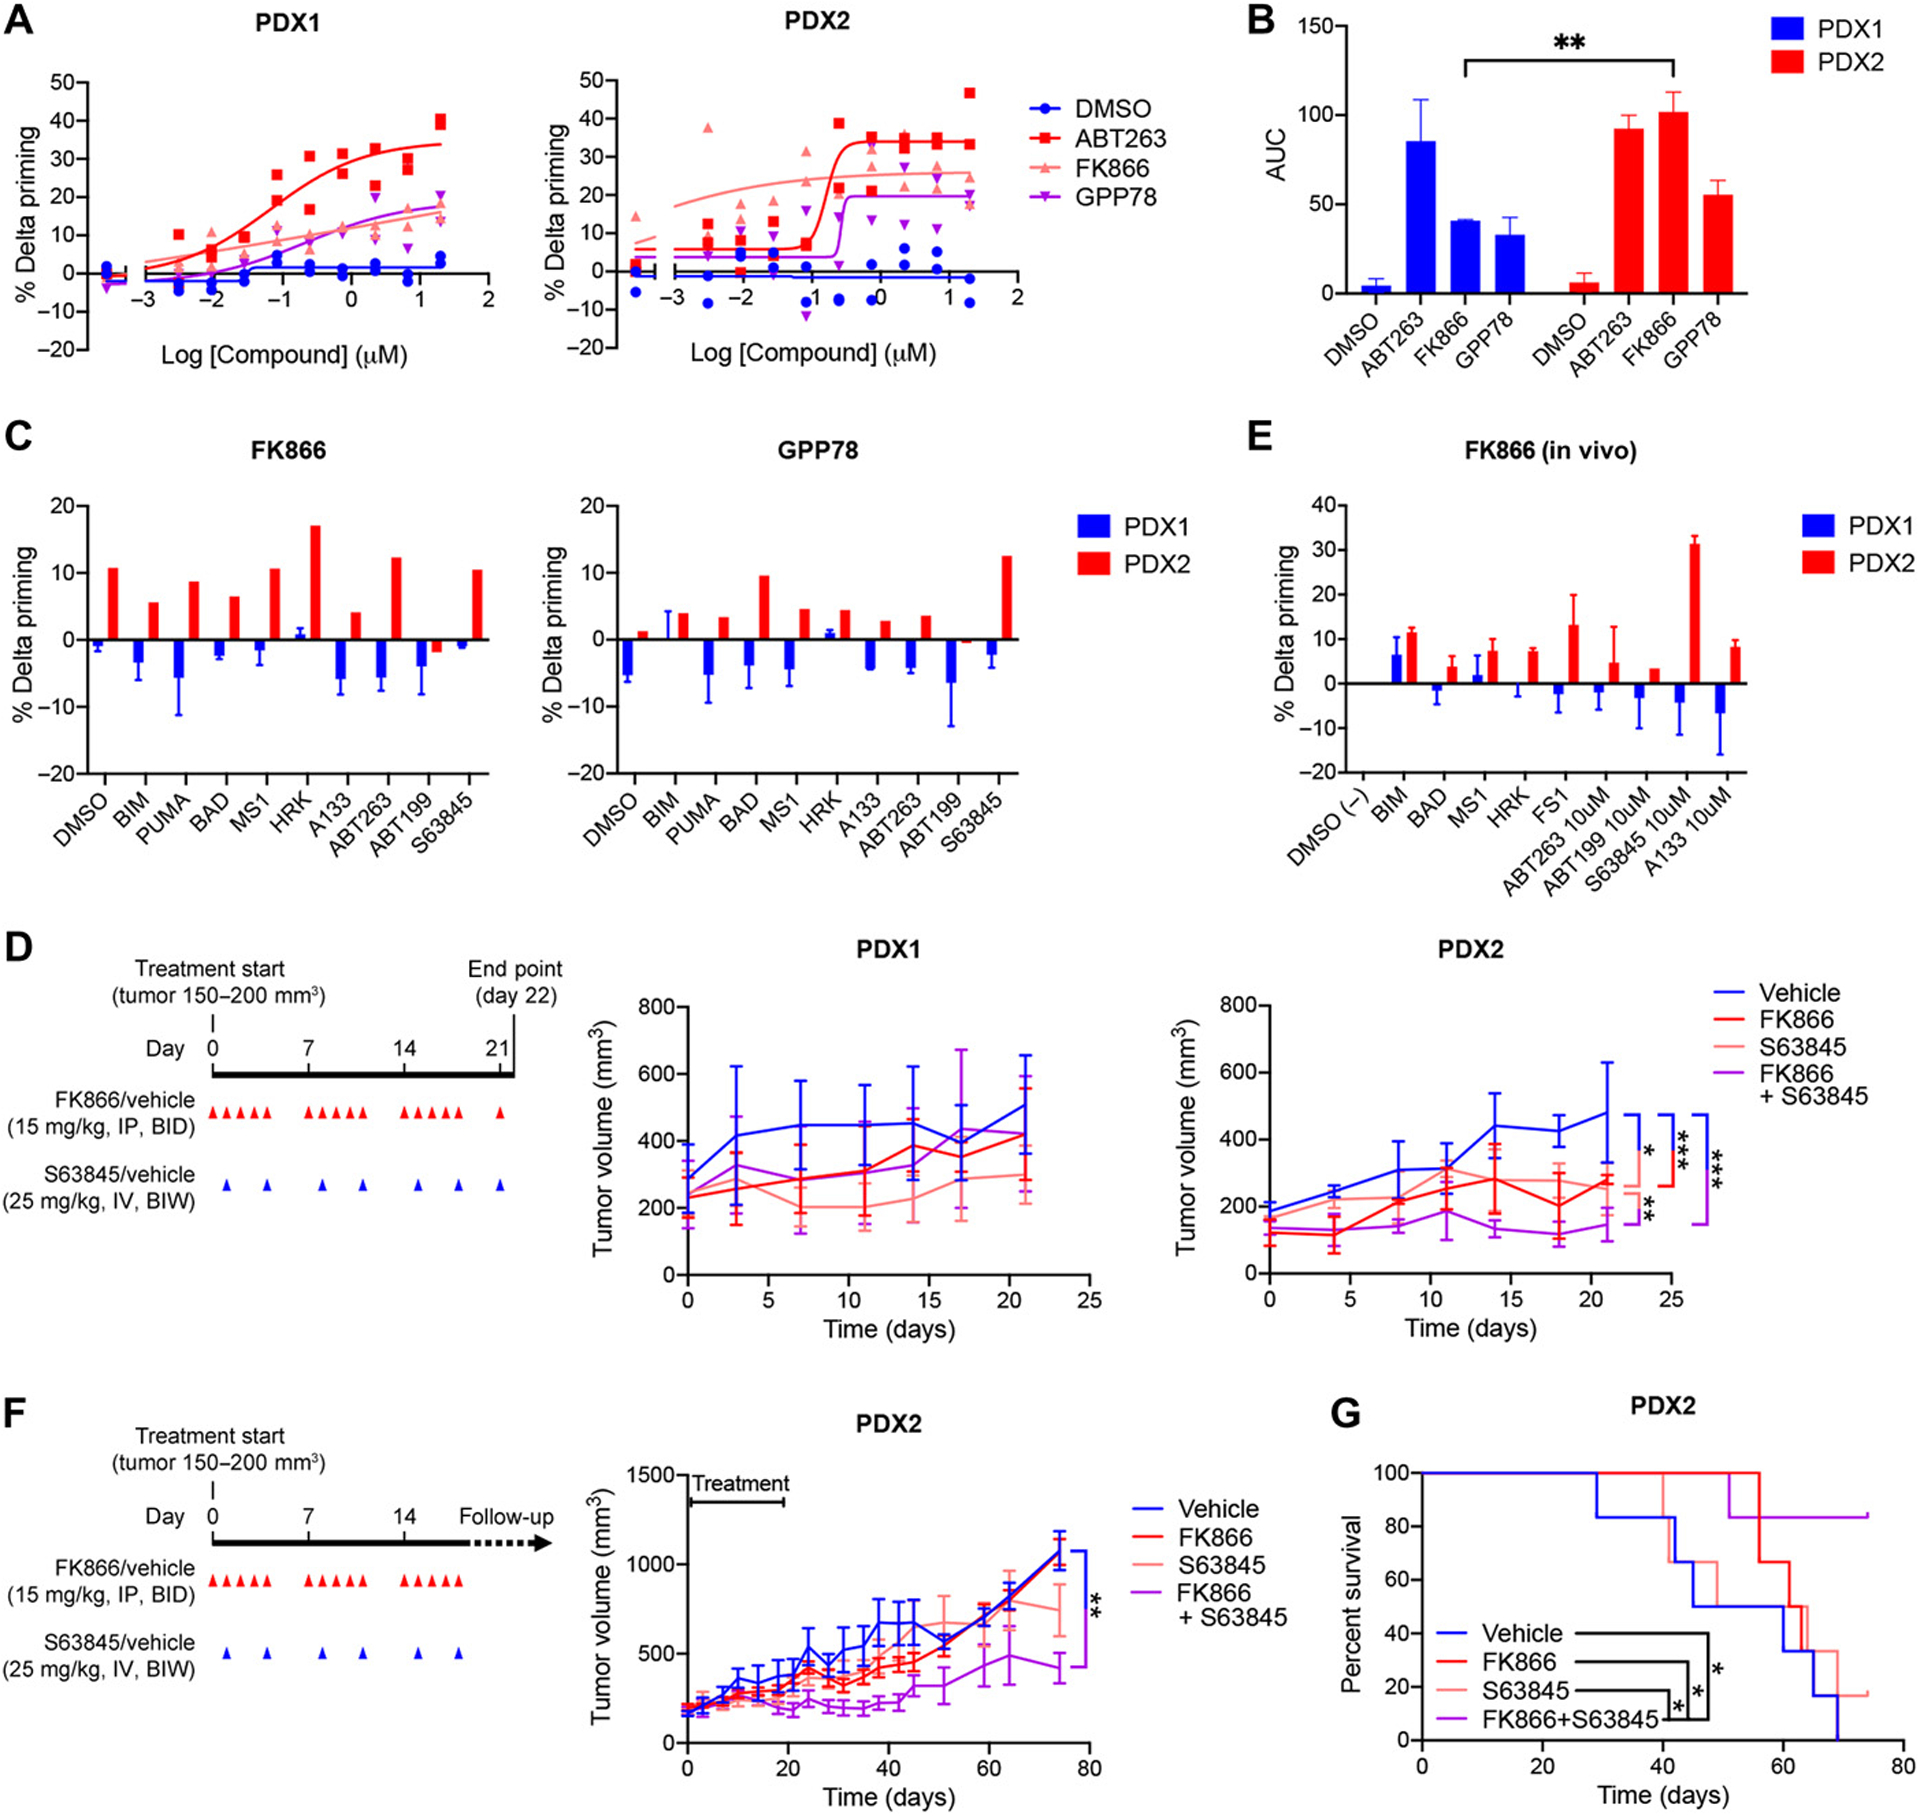
Figure 3. NAMPT inhibition increases overall mitochondrial apoptotic priming, anti-apoptotic dependencies and sensitivity to S63845 of TNBC PDX2 but not PDX1.

(A) Percentage delta priming of freshly isolated PDX1 and PDX2 tumor cells in vitro exposed to 0.01 μM FK866 and 0.1 μM GPP78 for 48 hours. Percent delta priming is calculated by comparing cytochrome c abundance in drug-treated versus vehicle-treated cells. ABT-263 is used as a positive control for induction of apoptotic priming, DMSO (vehicle) is used as a negative control. Data are average and SD of 2 or 3 independent experiments. (B) AUC and SD of % delta priming data shown in (A). Statistical analysis as done using two-way ANOVA with Sidak’s post-hoc test. (C) DBP of freshly isolated PDX1 and PDX2 tumor cells exposed in vitro to 0.01 μM FK866 and 0.1 μM GPP78 for 48 hours. Responses to the BIM and PUMA peptide indicates overall mitochondrial priming. Responses to the BAD, HRK, MS1, FS1 peptides and BH3 mimetics indicate specific anti-apoptotic dependencies. BAD and ABT-263 indicate BCL-2, BCL-XL or BCL-W dependency; HRK, A-133 and A-115 indicate BCL-XL dependency; ABT-199 indicates BCL-2 dependency; MS1 and S63845 indicate MCL-1 dependency. Data are average of two individual experiments. (D) Treatment schedule and volume of PDX1 and PDX2 tumors measured during the short-term efficacy study. Treatment was started when tumors reached 150–200mm3, indicated as Day 0 on x-axis. Red arrows indicate FK866 (15mg/kg) or vehicle (1% hydroxypropyl-β-cyclodextrin and 12% 1,2-propylenglycol in saline) treatment via intraperitoneal (I.P.) injection twice a day (BID). Blue arrows indicate S63845 (25 mg/kg) or vehicle (2% Vitamin E/TPGS) administration via intravenous (I.V.) injections twice a week (BIW). Mice were treated for 21 days and sacrificed on day 22. Tumor volume graphs show average and SD, n = 4 mice per treatment group. The trend in tumor volume changes by treatment across time were modeled using a linear mixed model with a random effect per subject, and a compound symmetry correlation structure using R 3.6.3. Family-wise error was adjusted via Tukey’s multiple correction method: *P <0.05; **P <0.01 and ***P <0.001; no statistical labelling indicates no statistical difference was observed. Combination treatment versus S63845, P=0.007; combination treatment versus vehicle, P<0.001; S63845 versus vehicle, P=0.021; and FK866 versus vehicle, P<0.001. (E) Percentage delta priming of PDX1 and PDX2 tumor cells at the day 22 end point of the short-term in vivo efficacy study in (D). Tumors were dissociated and BH3 profiling was performed on the freshly isolated tumor cells. Percentage delta priming refers to the difference in apoptotic priming of tumor cells derived from FK866-treated versus vehicle-treated animals. Data shown are average and SD, n = 3 or 4 tumors per treatment group. (F) Treatment schedule and PDX2 tumor volumes of mice in long-term efficacy study. Treatment was initiated when tumors reached 150–200mm3, indicated as Day 0 on x-axis. Red arrows indicate FK866 (15mg/kg) or vehicle (1% hydroxypropyl-β-cyclodextrin and 12% 1,2-propylenglycol in saline) treatment by intraperitoneal (I.P.) injection twice a day (BID). Blue arrows indicate S63845 (25mg/kg) or vehicle (2% vitamin E/TPGS) by intravenous (I.V.) injections twice a week (BIW). Mice were treated for 19 days. Animals were sacrificed when their tumors reached 1200 mm3. Study was ended when all vehicle treated animals reached tumor size of 1200 mm3 and were sacrificed (53 days post-treatment). Data are average and SD, n = 6 mice per treatment group. Statistical analysis as done using a Tukey’s multiple testing correction on a linear mixed model in R 3.6.3: **P <0.01; no statistical labelling means no statistical difference was observed. (G) Kaplan-Meier analysis of PDX2 data represented in (F). A logrank test was used to estimate a difference in survival effects across time between all treatments, multiple testing induced family-wise error was adjusted using Benjamini & Hochberg with R 3.6.3: *P <0.05.
