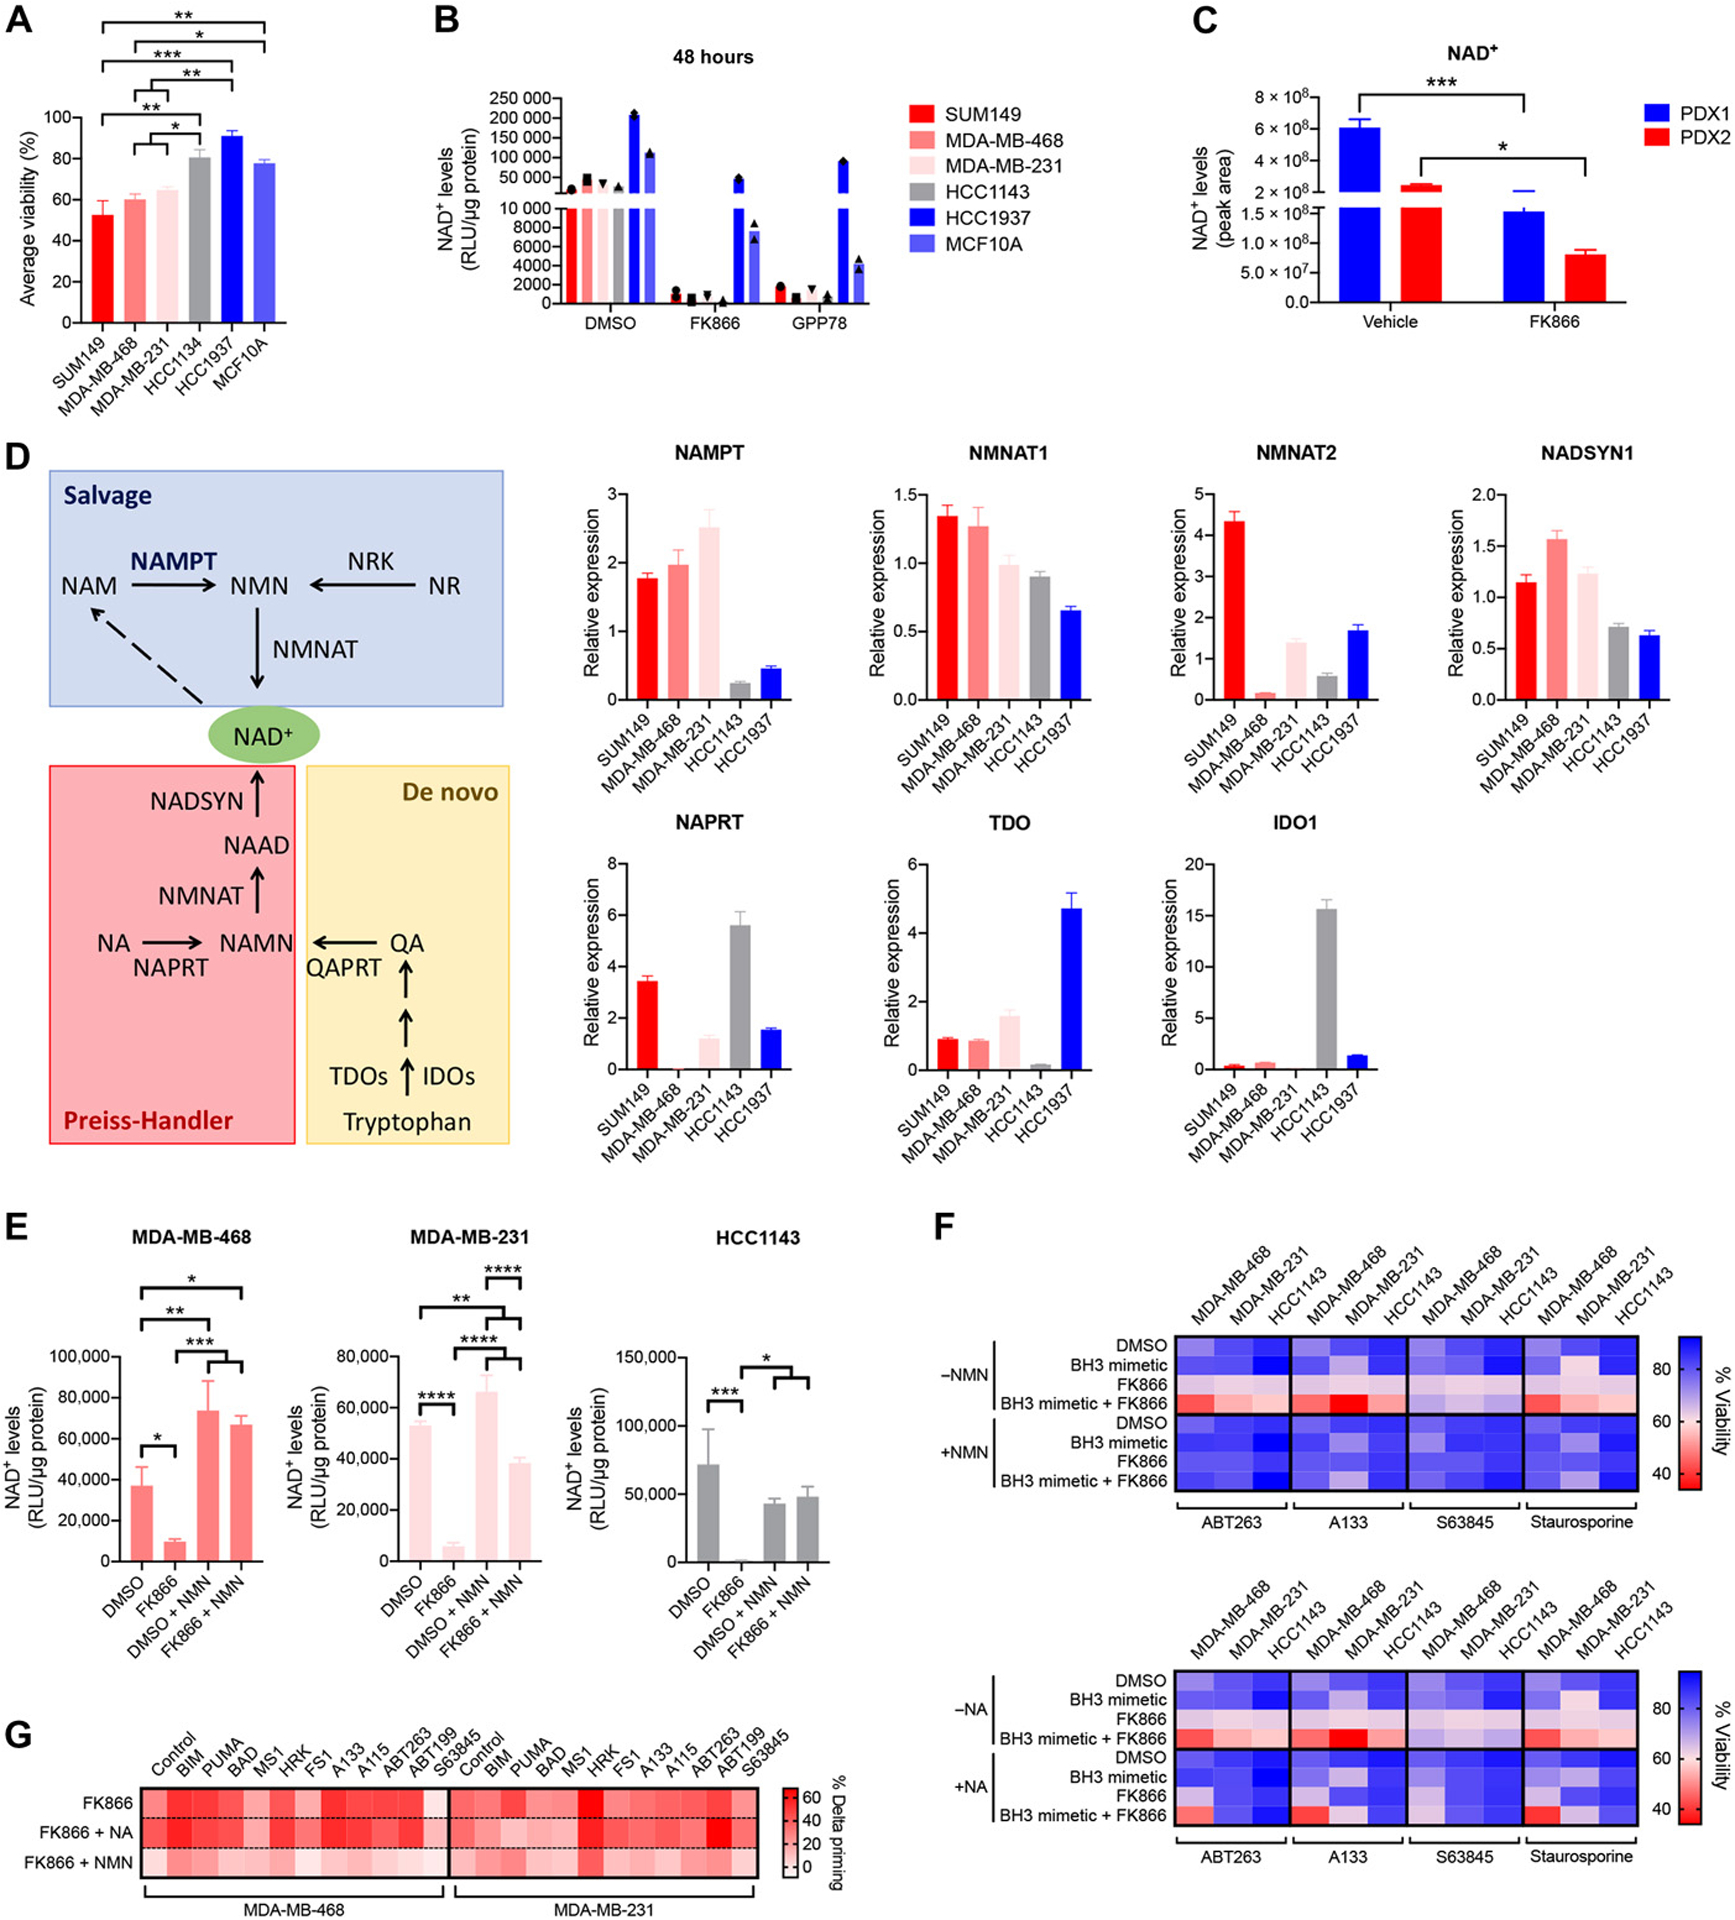
Figure 4. NAD+ levels need to drop below a critical level for apoptotic priming and anti-apoptotic dependencies to be increased in TNBC cells after NAMPT inhibition.

(A) Classification of TNBC cell lines according to their sensitivity for BH3 mimetics after NAMPT inhibition, based on the “average viability” calculated from the data presented in Fig. 2E and fig. S5:
Cell lines are indicated in shades of red for sensitive, shades of gray for intermediately sensitive, and shades of blue for insensitive lines. Statistical analysis as done using one-way ANOVA with Tukey’s post-hoc test. (B) NAD+ levels in indicated cell lines after 48 hours treatment with 0.01 μM FK866 or 0.1 μM GPP78, measured using the NAD/NADH kit (Promega). Data are average of 2 independent experiments. (C) NAD+ levels in PDX tumors after in vivo treatment with single-agent FK866 as described in Fig. 3D, measured using untargeted metabolomics and expressed as peak areas. Data are average and SD of n = 3 or 4 animals per treatment arm. Statistical analysis as done using one-way ANOVA with Tukey’s post-hoc test. (D) Schematics of different NAD+ synthesis pathways and expression levels of rate-limiting enzymes: de novo synthesis in yellow, Preiss-Handler pathway in red, and salvage pathway in blue. Abbreviations not yet defined:; NMNAT: NMN adenylyl transferase; NRKs: nicotinamide riboside kinases; NR: nicotinamide riboside; NADSYN: NAD synthetase; NAAD: nicotinic acid adenine dinucleotide; NAMN: nicotinic acid mononucleotide; QART: quinolinic acid phosphoribosyltransferase; QA: quinolinic acid. Expression levels of NAD+ synthesis enzymes are determined at baseline. Data are mean and SE of 3 independent experiments. (E) NAD+ levels in indicated cell lines after 24 hours treatment with 0.01 μM FK866 in the presence or absence of 25μM NMN, measured using the NAD/NADH kit (Promega). Data are mean and SD of 3 independent experiments. Statistical analysis as done using one-way ANOVA with Tukey’s post-hoc test. (F) Viability data of indicated cell lines treated for 72 hours with 0.01 μM FK866, 0.1 μM BH3 mimetics, 0.03 μM staurosporine or combination in the presence or absence of 25 μM nicotinamide mononucleotide (NMN) or 25 μM nicotinic acid (NA). Data are means of 3 independent experiments. Data also are presented as dot plots of average and SD in supplementary material (fig. S10). (G) Percentage delta priming of sensitive cell lines MDA-MB-468 and MDA-MB-231 after 48 hours exposure to 0.01 μM FK866 in the presence or absence of NA or NMN (25 μM). Data are means of 3 independent experiments. Data are also presented as bar graphs of average + SD in supplementary material (fig. S11).
