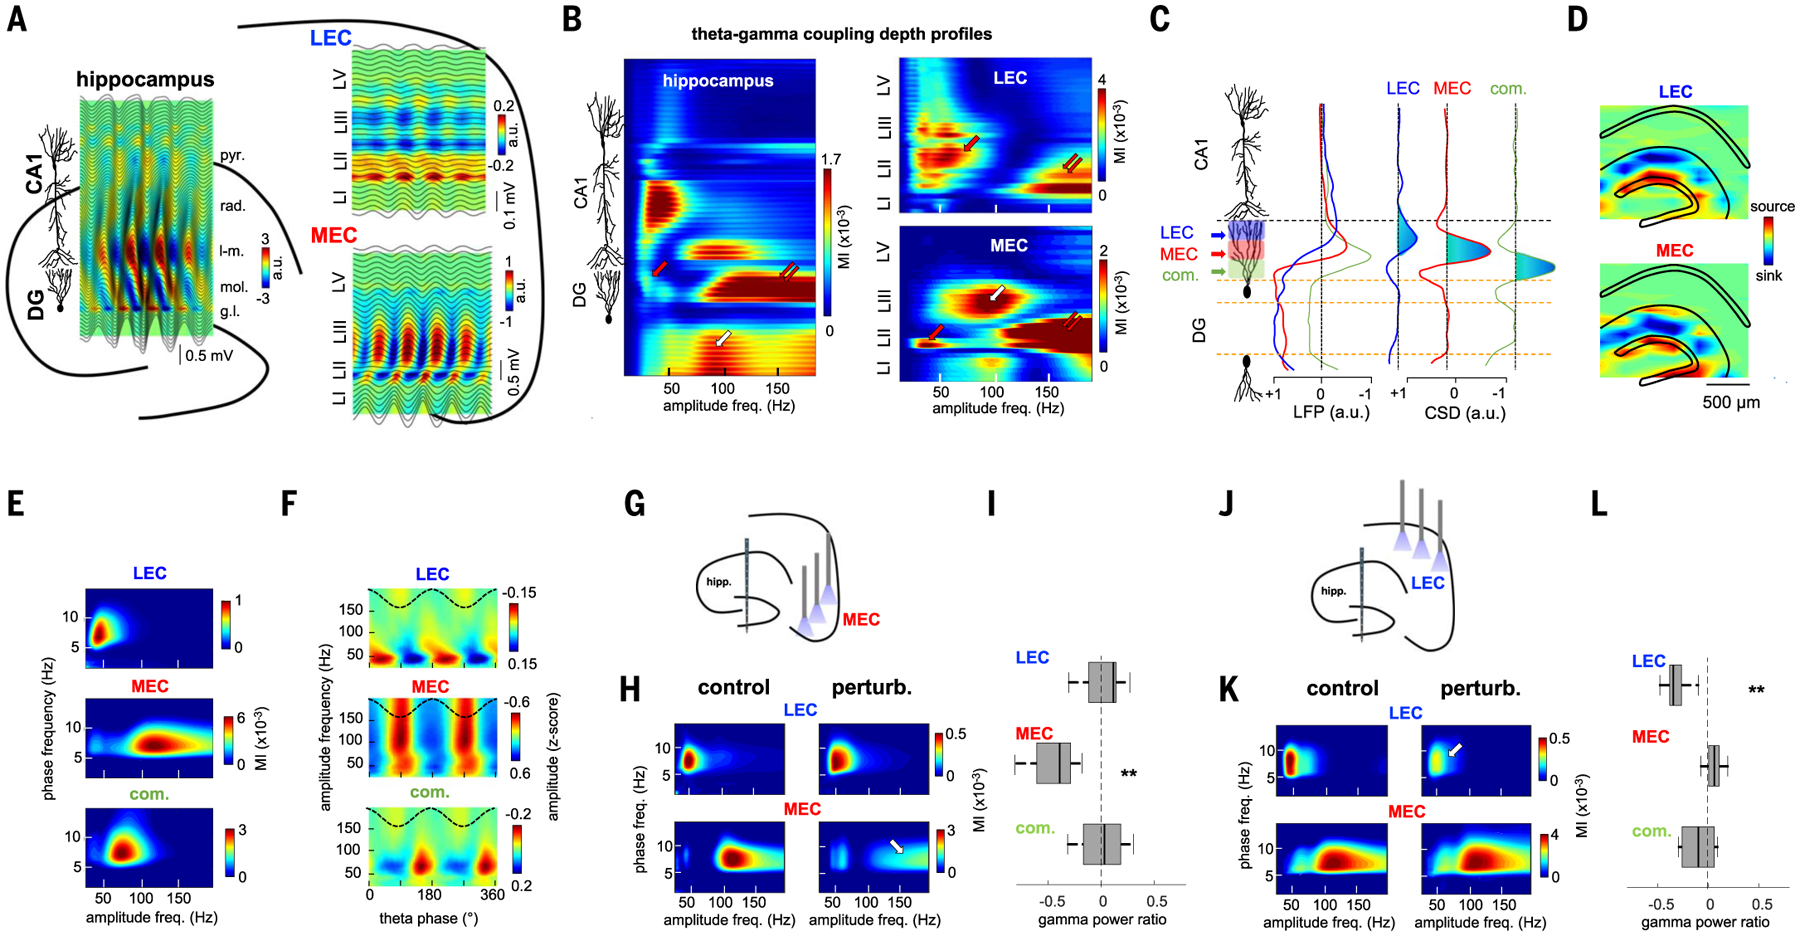
Fig. 3. MEC and LEC inputs project distinct gamma oscillations to the DG.

(A and B) Example laminar recordings across hippocampal, MEC, and LEC layers in the same animal. (A) Plots are depth profiles of averaged theta LFPs in each structure (black lines) superimposed on CSD color maps. Note the characteristic phase shift of theta oscillations across CA1pyr cell layer and EC layer 2. rad, stratum radiatum; l-m, stratum lacunosum-moleculare; mol, molecular layer; gl, GC layer; LI/II/III/V, entorhinal layers. (B) Gamma amplitude- theta frequency comodulograms (GA-TF) for each recording site (LFP) were concatenated into a single matrix. DG gammaS, gammaM, and gammaF are marked by red, white, and double arrows, respectively. (C) ICA decomposition of LFPs along the dorsoventral hippocampal axis resulted in three main ICs with currents restricted to the DG. Left: IC depth voltage profiles. Right: IC second spatial derivative (CSD). Current sinks are indicated in blue. (D) 2D CSD maps of LEC and MEC were back-projected to the anatomical electrode space (eight shanks paced 300 μm, each with 32 recording sites). (E) GA-TF comodulograms for each IC displayed modulation in a specific gamma sub-band (group data from n = 12 rats): LEC in gammaS (45 ± 2 Hz), MEC in gammaF (115 ±3 Hz), and commissural in gammaM (63 ± 3 Hz). (F) LEC, MEC, and commissural-projected gamma oscillations occur on the descending phase (47 ± 9°), trough (168 ± 3°), and ascending theta phase (284 ± 8°), respectively. Reference theta phase (black dashed line) from CA1pyr cell layer is also shown. (G) Schematic of MEC perturbation experiment. (H) GA-TF comodulograms for the LEC and MEC gamma components in an example animal without (left) and with MEC optogenetic perturbation (right). Note the strong decrease in power in MEC gammaF (arrow). (I) Group results of the effect of MEC perturbation on the power (control − perturbation/control + perturbation) of the different gamma oscillations (ICs) in the DG (**P = 3.9 × 10⁻³, signed-rank test; n = 6 rats). (J to L) Same as (D) to (F) but during LEC perturbation (**P = 0.002; n = 6 rats). MEC perturbation had stronger effect on MEC gammaM than did LEC perturbation (P = 4.1 × 10⁻⁵, rank-sum test), whereas the opposite was true for LEC gammaS (P = 6.3 × 10⁻⁴).
