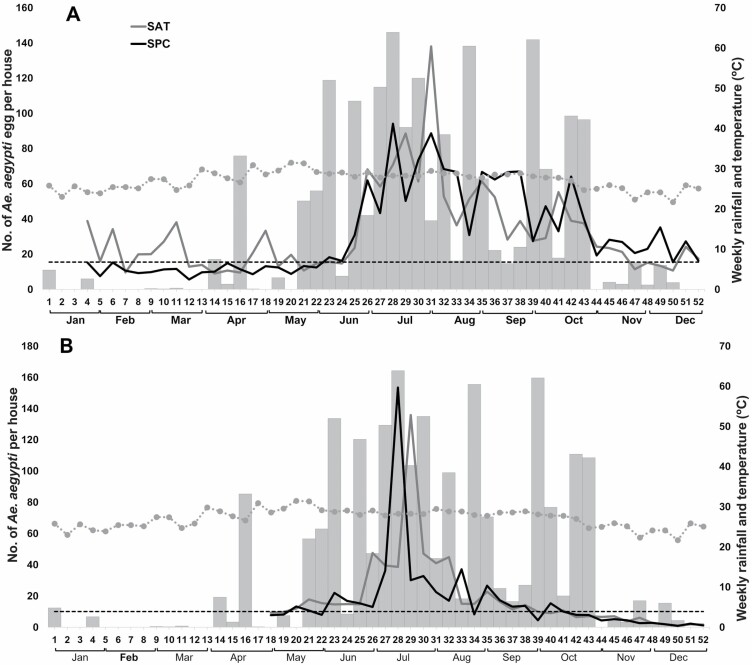
Fig. 3.
(A) Average number of Ae. aegypti eggs per total ovitraps/house per week; (B) average number of adult Ae. aegypti (females and males) collected in 24-h cycles at BG traps/houses per week and average temperature (dotted gray line) and monthly rainfall (gray bars) during 2017 in SPC and TAH. The dotted horizontal line represents the weekly average of Aedes abundance for both localities during the dry season (W1–W20).

