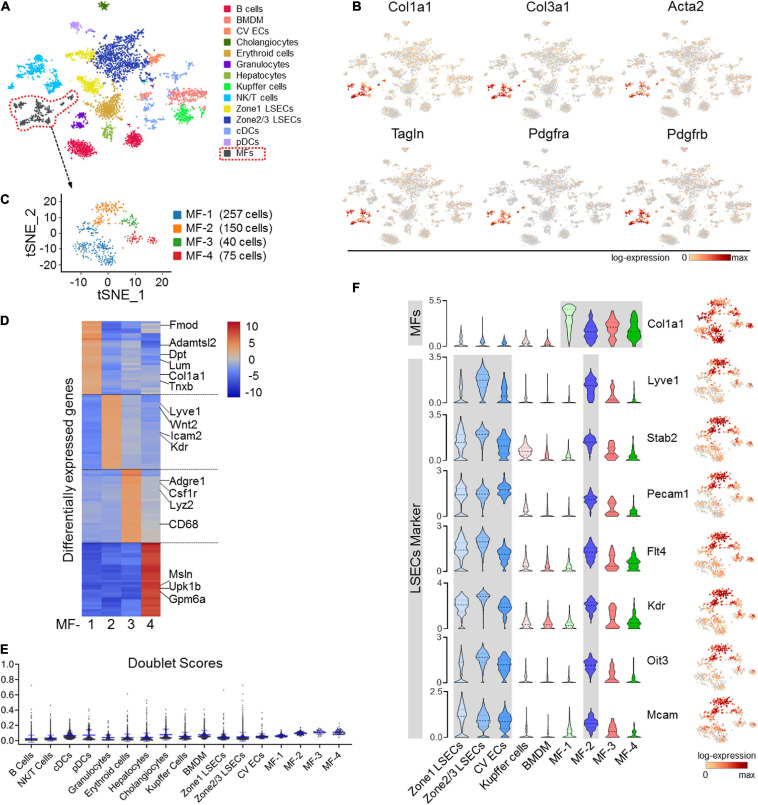
FIGURE 1.
scRNA-seq of NPCs in CCl4-induced liver fibrosis. (A) Clustering of 6,437 cells (mean number of genes per cell = 1,768) from the liver NPCs of a CCl4-treated male mouse. (B) The expression of representative MF marker genes, including Col1a1, Col3a1, Acta2 (α-SMA), Tagln (SM22), Pdgfra, and Pdgfrb, in the population (marked with dotted lines in red) was visualized by gene tSNE. (C) The MF population in (A) was further clustered into four subsets and visualized by gene tSNE. (D) The top 30 differentially expressed genes in the four MF subpopulations are illustrated by heat map. (E) Cell doublet scores of the fibrotic-NPCs per cluster. (F) Individual gene tSNE and violin plots are used to show the expression of MF marker Col1a1 and LSEC markers Lyve1, Stab2, Pecam1, Flt4, Kdr, Oit3, and Mcam across different cell types. The y-axis is the log-scale normalized read count.

