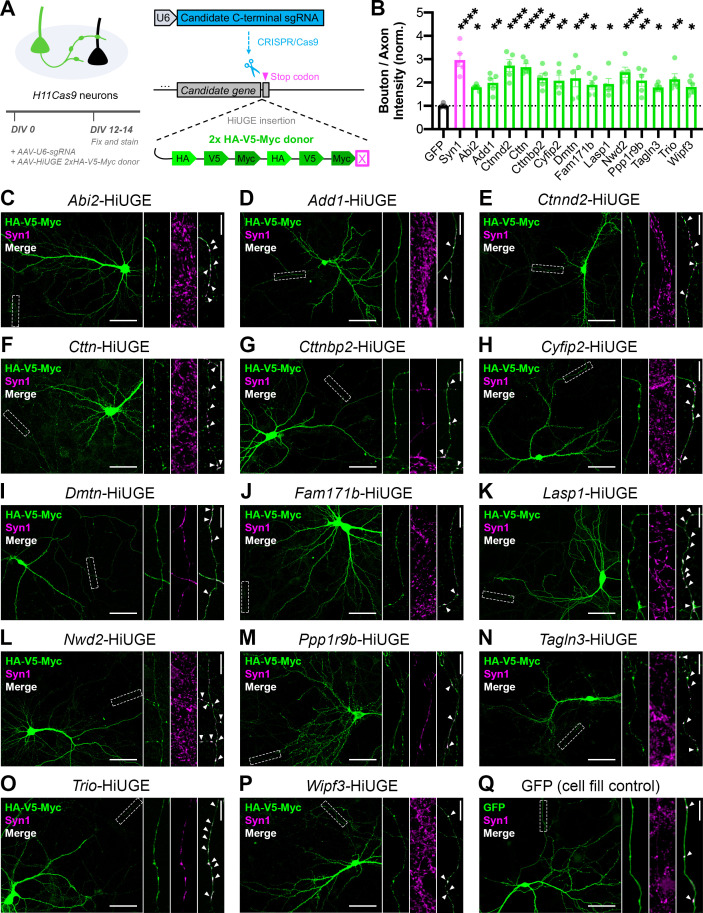
Figure 2. Validation of the presynaptic localization of Synapsin iBioID proteins.
(A) Schematic of approach to tag endogenous proteins in neurons using HiUGE. Cultured hippocampal neurons were infected on DIV0 with AAVs containing the candidate sgRNA and a 2x-HA-V5-Myc HiUGE donor in the corresponding open reading frame. Neurons expressing a GFP cell fill were used as a control. (B) Quantification of presynaptic enrichment for GFP control (n=6 neurons), presynaptic marker Syn1 (Synapsin1, n=5), and candidate proteins (Abi2 n=6, Add1 n=5, Ctnnd2 n=5, Cttn n=5, Cttnbp2 n=5, Cyfip2 n=5, Dmtn n=5, Fam171b n=5, Lasp1 n=5, Nwd2 n=5, Ppp1r9b n=5, Tagln3 n=6, Trio n=5, Wipf3 n=6); one-way ANOVA (F15,68=5.401, p<0.0001) with Dunnett’s multiple comparisons test vs GFP: Syn1 (p<0.0001), Abi2 (p=0.0422), Add1 (p=0.0088), Ctnnd2 (p<0.0001), Cttn (p<0.0001), Cttnbp2 (p=0.0008), Cyfip2 (p=0.0032), Dmtn (p=0.0010), Fam171b (p=0.0215), Lasp1 (p=0.0156), Nwd2 (p<0.0001), Ppp1r9b (p=0.0030), Tagln3 (p=0.0437), Trio (p=0.0016), Wipf3 (p=0.0359). (C–Q) Representative images of the localization of candidate proteins (HA/V5/Myc or GFP; green) and a presynaptic marker (Synapsin1; magenta). Scale bars, 50 μm. Insets show staining along axons. The merged image contains only Synapsin1 puncta within the axon, and white arrows point to presynaptic terminals (colocalized puncta). Scale bars, 5 μm. All data are mean ± SEM. *p<0.05, **p<0.01, ***p<0.001, ****p<0.0001.

