. 2021 Jul 16;10:e63756. doi: 10.7554/eLife.63756

Figure 4. Presynaptic Rac1 negatively regulates synaptic vesicle replenishment.

(A) Schematic of mixed hippocampal neuron cultures to isolate effects of presynaptic Rac1 knockout. Whole-cell patch clamp recordings were conducted on tdTomato+ WT neurons with light delivered through the objective by a 460 nm LED. (B) Representative images of WT and KO cultures fixed on DIV16 and stained for ChR2-EYFP (blue), tdTomato (magenta), and Rac1 (green). Scale bars, 15 μm. (C–E) Light-evoked EPSCs in WT and KO cultures. Representative traces and quantification for: (C) PPR (WT n=15 neurons/3 cultures, KO n=17/3); two-way repeated measures ANOVA (F1,30=0.1462, p=0.7049). (D) Strontium-evoked qEPSCs (WT n=16/3, KO n=17/3) with amplitude (U=130, p=0.8451) and frequency (U=120, p=0.5814). (E) 20 Hz stimulation trains (WT n=15/3, KO n=16/3) with release probability (t29=0.4671, p=0.6439), RRP size (t29=1.271, p=0.2137), and replenishment rate (t29=2.574, p=0.0154). (F–H) Light-evoked IPSCs in WT and KO cultures. Representative traces and quantification for: (F) PPR (WT n=12/3, KO n=11/3); two-way repeated measures ANOVA (F1,21=0.04765, p=0.8293). (G) Strontium-evoked qIPSCs (WT n=13/3, KO n=12/3) with amplitude (t23=0.2064, p=0.6798) and frequency (t23=0.2064, p=0.8383). (H) 20 Hz stimulation trains (WT n=13/3, KO n=13/3) with release probability (t24=0.9657, p=0.3438), RRP size (t24=0.9253, p=0.3640), and replenishment rate (t29=2.382, p=0.0255). All data are mean ± SEM. *p<0.05, n.s. not significant. t values are t-tests, and U values are Mann-Whitney U-tests.

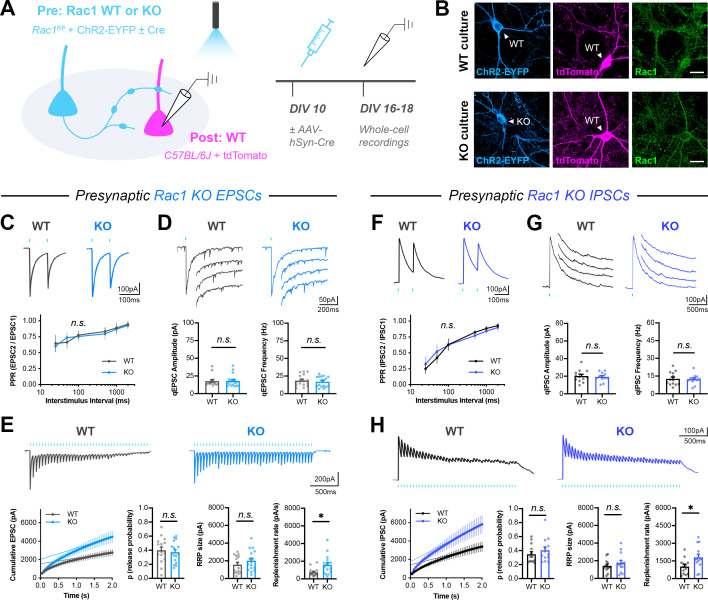
Figure 4.

Figure 4—figure supplement 1. Characterization of neuronal cultures used for electrophysiology.

Figure 4—figure supplement 1.

(A) Representative image of an entire coverslip used for presynaptic isolation. Presynaptic neurons expressing an opsin (ChR2-EYFP; green) were sparsely seeded amongst other neurons (NeuN; magenta). Scale bars, 2 mm and 250 μm (inset). (B) Number of presynaptic ChR2+ or ChrimsonR+ neurons per coverslip for each electrophysiology experiment. Figure 4 (WT n=three coverslips/3 cultures, KO n=3/3); t-test (t4=0.1364, p=0.8981). Figure 5 (WT n=3/3, KO n=3/3); t-test (t4=0.2703, p=0.8003). Figure 7 (WT Scr n=3/3, WT W56 n=3/3, KO Scr n=3/3, KO W56 n=3/3); one-way ANOVA (F3,8=0.1792, p=0.9075). Figure 8 (WT n=3/3, DN n=3/3, CA Scr n=3/3); one-way ANOVA (F2,6=0.6262, p=0.5663). (C) Schematic of CaMPARI2 experiment to assess the radius of activation by optical or electrical stimulation. (D) Representative images of entire coverslips without stimulation or with optical stimulation. All neurons are labeled by CaMPARI2-green (green), and activated neurons are labeled by CaMPARI2-red (magenta). Scale bars, 2 mm. (E) Representative image of a culture after electrical stimulation. All neurons are labeled by CaMPARI2-green (green), and activated neurons are labeled by CaMPARI2-red (magenta). Scale bar, 500 μm. (F–G) Estimated number of (F) excitatory and (G) inhibitory presynaptic neurons activated for each electrophysiology experiment. All data are mean ± SEM. n.s. not significant.
Figure 4—figure supplement 2. Single evoked currents and asynchronous release in Rac1 neurons.

Figure 4—figure supplement 2.

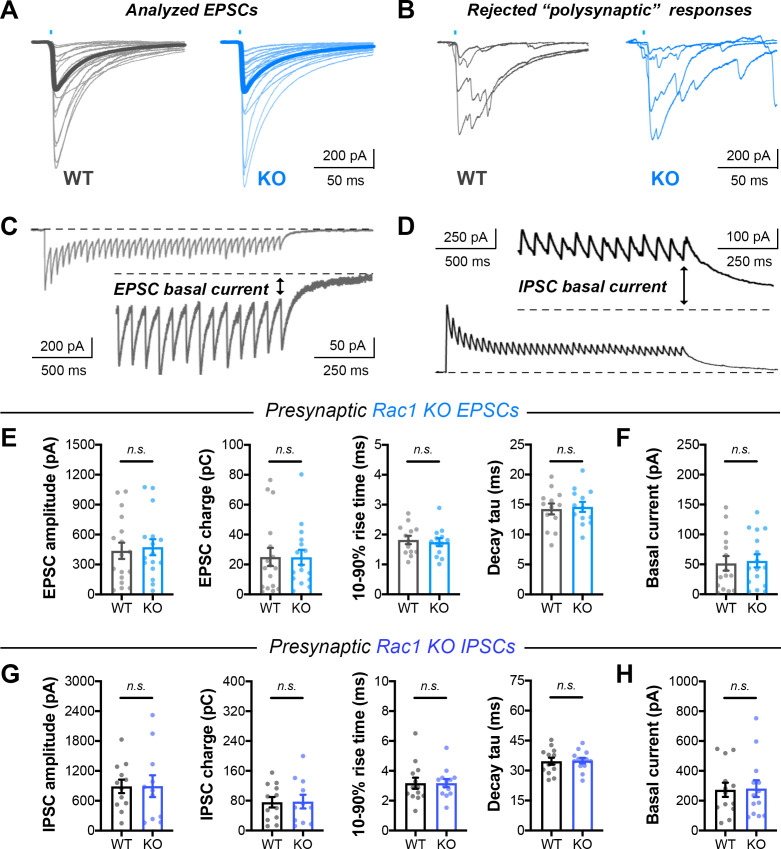
(A) Traces of all analyzed EPSCs in presynaptic Rac1 KO experiments. (B) Examples of rejected responses contaminated by ‘polysynaptic’ or recurrent events. (C–D) Visual representation of steady-state basal current in (C) EPSC trains and (D) IPSC trains. (E) Quantification of single evoked EPSCs in Rac1 cultures (WT n=17 neurons/3 cultures, KO n=16/3) for amplitude (t31=0.3127, p=0.7566), charge (U=123, p=0.6567), rise time (t31=0.5223, p=0.6051), and decay time constant (t31=0.08846, p=0.9301). (F) Basal current in Rac1 EPSC trains (WT n=15/3, KO n=16/3; t29=0.2560, p=0.7998). (G) Quantification of IPSCs in Rac1 cultures (WT n=12/3, KO n=11/3) for amplitude (t21=0.01487, p=0.9883), charge (t21=0.07053, p=0.9444), rise time (t21=0.5311, p=0.6009), and decay time constant (t21=0.3887, p=0.7014). (H) Basal current in Rac1 IPSC trains (WT n=13/3, KO n=13/3; U=83, p=0.9598). All data are mean ± SEM. n.s. not significant. t values are t-tests, and U values are Mann-Whitney U-tests.
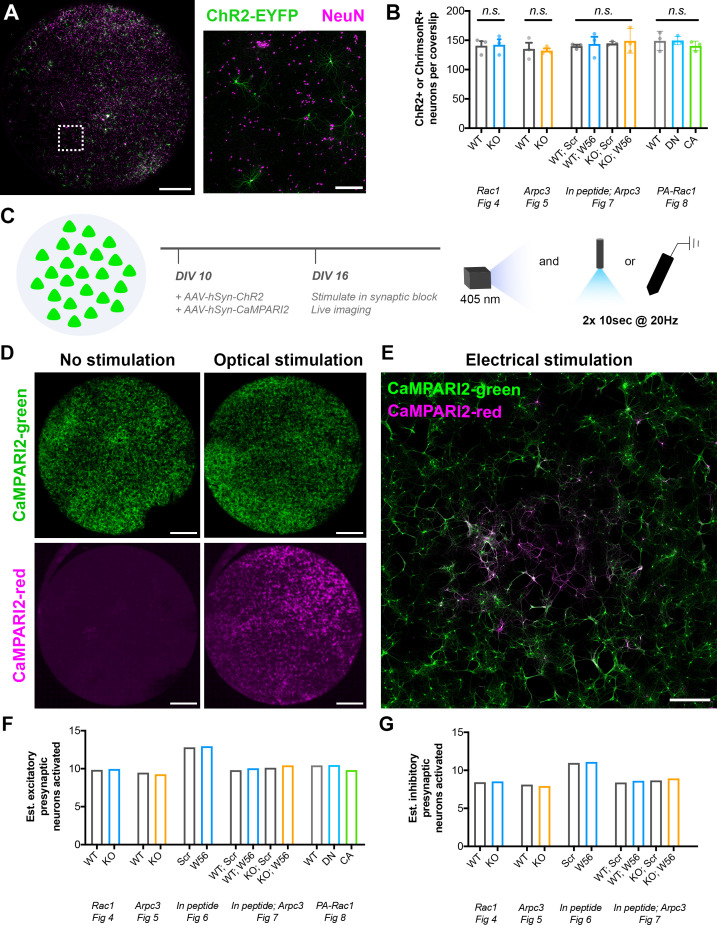
Figure 4—figure supplement 3. Comparison of optogenetic and electrical stimulation in elevated extracellular calcium.

Figure 4—figure supplement 3.

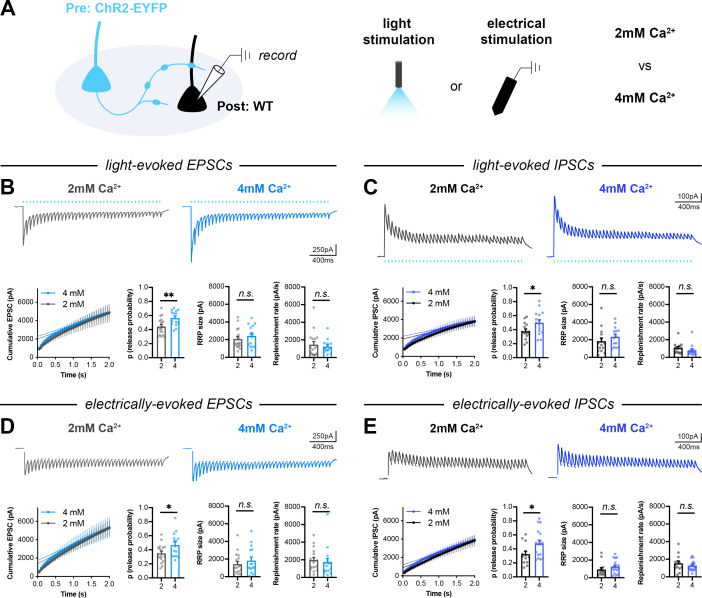
(A) Schematic of mixed hippocampal cultures. Whole-cell patch clamp recordings were conducted on non-fluorescent WT neurons with light delivered through the objective by a 460 nm LED and electrical stimulation delivered by a bipolar electrode. Recordings were conducted in 2 mM or 4 mM extracellular calcium. (B) Light-evoked EPSCs. Representative traces and quantification for 20 Hz stimulation trains (2 mM n=17/3, 4 mM n=14/3) with release probability (t29=2.855, p=0.0079), RRP size (U=101, p=0.4928), and replenishment rate (U=118, p=0.9844). (C) Light-evoked IPSCs. Representative traces and quantification for 20 Hz stimulation trains (2 mM n=14/3, 4 mM n=15/3) with release probability (t27=2.207, p=0.0360), RRP size (U=71, p=0.1456), and replenishment rate (U=65, p=0.0848). (D) Electrically-evoked EPSCs. Representative traces and quantification for 20 Hz stimulation trains (2 mM n=17/3, 4 mM n=15/3) with release probability (t30=2.202, p=0.0355), RRP size (U=110, p=0.5261), and replenishment rate (U=96, p=0.2455). (E) Electrically evoked IPSCs. Representative traces and quantification for 20 Hz stimulation trains (2 mM n=13/3, 4 mM n=17/3) with release probability (t28=2.287, p=0.0300), RRP size (U=77, p=0.1698), and replenishment rate (t28=0.9130, p=0.3690). All data are mean ± SEM. *p<0.05, **p<0.01, n.s. not significant. t values are t-tests, and U values are Mann-Whitney U-tests.