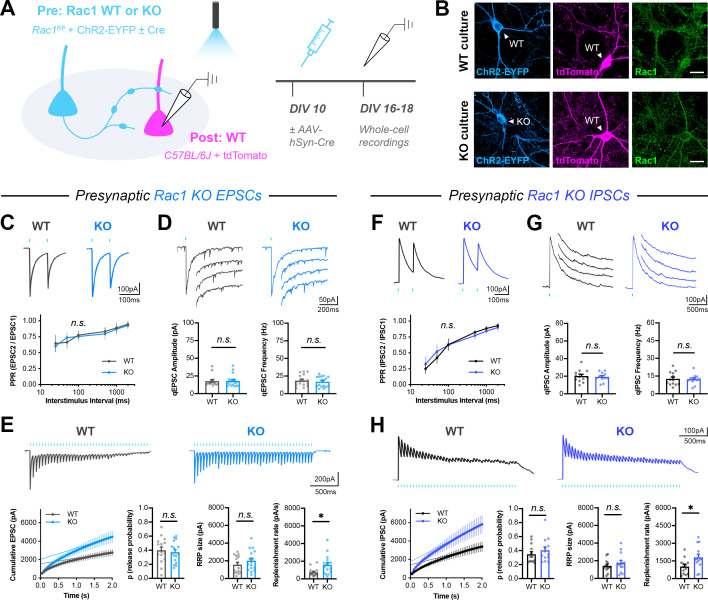
Figure 4. Presynaptic Rac1 negatively regulates synaptic vesicle replenishment.
(A) Schematic of mixed hippocampal neuron cultures to isolate effects of presynaptic Rac1 knockout. Whole-cell patch clamp recordings were conducted on tdTomato+ WT neurons with light delivered through the objective by a 460 nm LED. (B) Representative images of WT and KO cultures fixed on DIV16 and stained for ChR2-EYFP (blue), tdTomato (magenta), and Rac1 (green). Scale bars, 15 μm. (C–E) Light-evoked EPSCs in WT and KO cultures. Representative traces and quantification for: (C) PPR (WT n=15 neurons/3 cultures, KO n=17/3); two-way repeated measures ANOVA (F1,30=0.1462, p=0.7049). (D) Strontium-evoked qEPSCs (WT n=16/3, KO n=17/3) with amplitude (U=130, p=0.8451) and frequency (U=120, p=0.5814). (E) 20 Hz stimulation trains (WT n=15/3, KO n=16/3) with release probability (t29=0.4671, p=0.6439), RRP size (t29=1.271, p=0.2137), and replenishment rate (t29=2.574, p=0.0154). (F–H) Light-evoked IPSCs in WT and KO cultures. Representative traces and quantification for: (F) PPR (WT n=12/3, KO n=11/3); two-way repeated measures ANOVA (F1,21=0.04765, p=0.8293). (G) Strontium-evoked qIPSCs (WT n=13/3, KO n=12/3) with amplitude (t23=0.2064, p=0.6798) and frequency (t23=0.2064, p=0.8383). (H) 20 Hz stimulation trains (WT n=13/3, KO n=13/3) with release probability (t24=0.9657, p=0.3438), RRP size (t24=0.9253, p=0.3640), and replenishment rate (t29=2.382, p=0.0255). All data are mean ± SEM. *p<0.05, n.s. not significant. t values are t-tests, and U values are Mann-Whitney U-tests.


