. 2021 Jul 16;10:e63756. doi: 10.7554/eLife.63756

Figure 5. Presynaptic Arp2/3 negatively regulates release probability and synaptic vesicle replenishment.

(A) Schematic of mixed hippocampal neuron cultures to isolate effects of presynaptic Arpc3 knockout. (B) Representative images of WT and KO cultures fixed on DIV16 and stained for ChR2-EYFP (blue), tdTomato (magenta), and DAPI (green). Scale bars, 25 μm. (C–E) Light-evoked EPSCs in WT and KO cultures. Traces and quantification for: (C) PPR (WT n=10 neurons/3 cultures, KO n=12/3); two-way repeated measures ANOVA (F1,20=22.50, p=0.0001) with Sidak’s multiple comparisons test: 25 ms (p=0.0435), 50 ms (p=0.0194), 100 ms (p=0.0099), 500 ms (p=0.2168), 1000 ms (p=0.2319), 2000 ms (p=0.6130). (D) Strontium-evoked qEPSCs (WT n=9/3, KO n=8/3) with amplitude (U=31, p=0.6730) and frequency (t15=2.973, p=0.0095). (E) 20 Hz stimulation trains (WT n=10/3, KO n=10/3) with release probability (t18=2.107, p=0.0494), RRP size (t18=0.3957, p=0.3957), and replenishment rate (t18=2.215, p=0.0399). (F–H) Light-evoked IPSCs in WT and KO cultures. Traces and quantification for: (F) PPR (WT n=14/3, KO n=13/3); two-way repeated measures ANOVA (F1,25=16.41, p=0.0004) with Sidak’s multiple comparisons test: 25 ms (p=0.0022), 50 ms (p=0.0117), 100 ms (p=0.0111), 500 ms (p=0.4100), 1000 ms (p=0.9999), 2000 ms (p=0.3992). (G) Strontium-evoked qIPSCs (WT n=14/3, KO n=15/3) with amplitude (t27=0.3989, p=0.6931) and frequency (t27=2.471, p=0.0201). (H) 20 Hz stimulation trains (WT n=14/3, KO n=14/3) with release probability (U=52, p=0.0350), RRP size (t26=0.6733, p=0.5067) and replenishment rate (t26=3.621, p=0.0012). All data are mean ± SEM. *p<0.05, **p<0.01, n.s. not significant. t values are t-tests, and U values are Mann-Whitney U-tests.

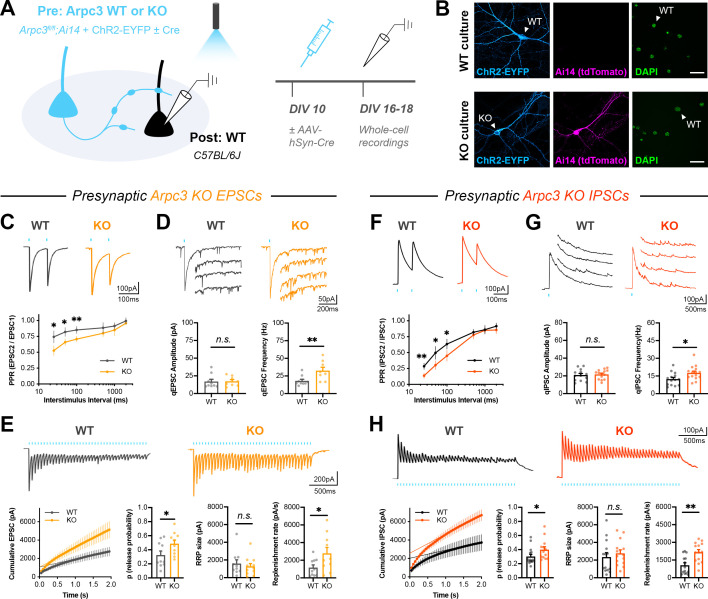
Figure 5.

Figure 5—figure supplement 1. Single evoked currents and asynchronous release in Arpc3 neurons.

Figure 5—figure supplement 1.

(A) Quantification of EPSCs in Arpc3 cultures (WT n=10/3, KO n=10/3) for amplitude (t18=2.323, p=0.0321), charge (t18=2.127, p=0.0475), rise time (U=38, p=0.3811), and decay time constant (U=17, p=0.0111). (B) Basal current in Arpc3 EPSC trains (WT n=10/3, KO n=10/3; U=42, p=0.5787). (C) Quantification of IPSCs in Arpc3 cultures (WT n=12/3, KO n=14/3) for amplitude (U=44, p=0.0407), charge (U=42, p=0.0310), rise time (U=78, p=0.7810), and decay time constant (U=36, p=0.0127). (D) Basal current in Arpc3 IPSC trains (WT n=14/3, KO n=14/3; U=72, p=0.2456). All data are mean ± SEM. *p<0.05, n.s. not significant. t values are t-tests, and U values are Mann-Whitney U-tests.
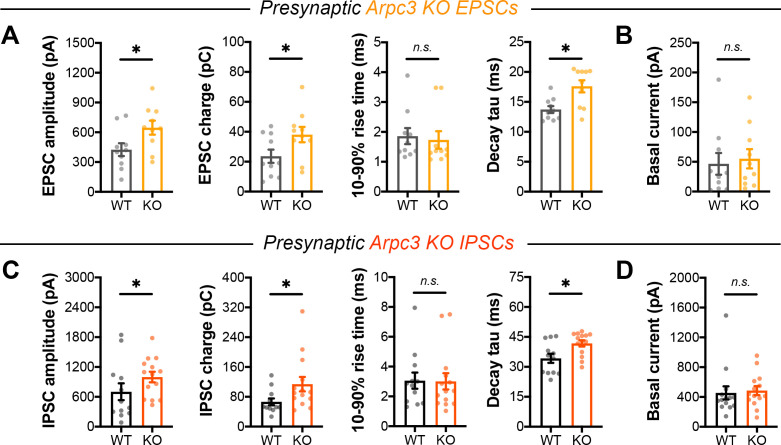
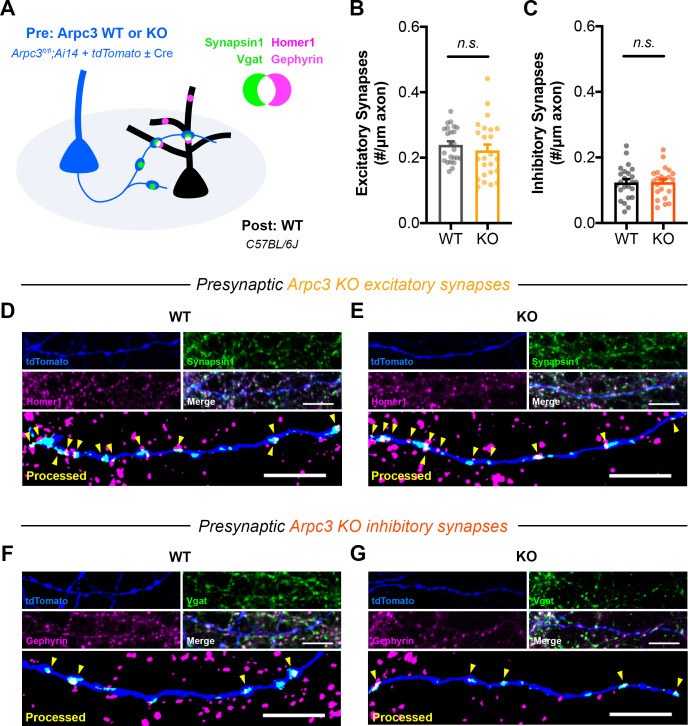
Figure 5—figure supplement 2. ArpC3 loss does not affect the density of synapses formed along axons.

Figure 5—figure supplement 2.

(A) Schematic of mixed hippocampal neuron cultures to isolate effects of Arpc3 knockout on axonal synapse density. Arpc3fl/fl;Ai14 neurons were electroporated with tdTomato and sparsely seeded amongst WT neurons on DIV0. To limit developmental effects, AAV-hSyn-Cre was added on DIV10 to half the coverslips. Neurons were fixed on DIV16 and stained for excitatory (Synapsin1, Homer1) or inhibitory (Vgat, Gephyrin) synapse markers. (B) Excitatory synapse density along axons (WT n=24 neurons/3 cultures, KO n=24/3); t-test (t46=0.8180, p=0.4176). (C) Inhibitory synapse density along axons (WT n=24/3, KO n=23/3); t-test (t45=0.9572, p=0.9572). (D–E) Representative images of (D) WT and (E) KO axons stained for tdTomato (blue), Synapsin1 (green), and Homer1 (magenta). Synapsin1 puncta were masked inside tdTomato+ axons and counted as synapses (yellow arrows) if they colocalized with Homer1 puncta. Scale bars: 10 μm. (F–G) Representative images of (F) WT and (G) KO axons stained for tdTomato (blue), Vgat (green), and Gephyrin (magenta). Vgat puncta were masked inside tdTomato+ axons and counted as synapses (yellow arrows) if they colocalized with Gephyrin puncta. Scale bars, 10 μm. All data are mean ± SEM. n.s. not significant.
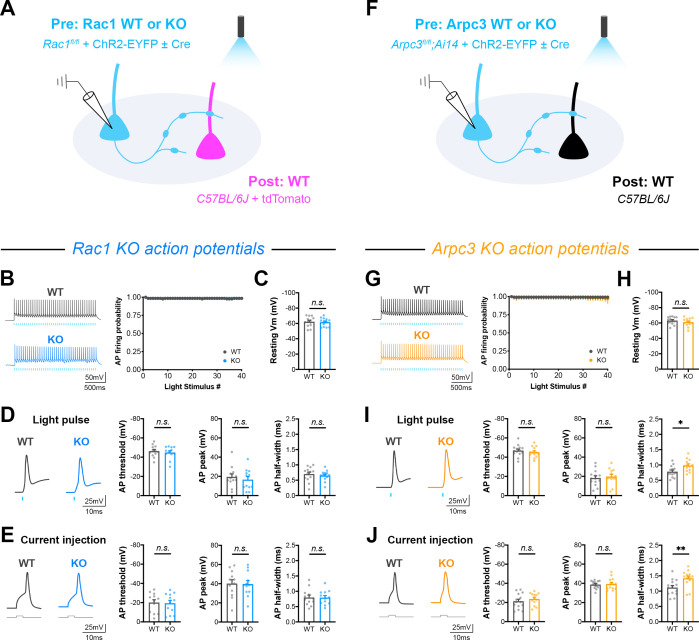
Figure 5—figure supplement 3. Action potential firing and intrinsic membrane properties in Rac1 and Arpc3 neurons.

Figure 5—figure supplement 3.

(A) Schematic of Rac1 mixed hippocampal neuron cultures. Current clamp recordings were conducted from ChR2+ neurons with light delivered through the objective by a 460 nm LED (WT n=12 neurons/3 cultures, KO n=12/3). (B) Probability of firing action potentials during a 20 Hz light stimulation train (two-way repeated measures ANOVA, F1,22=0.004558, p=0.9468). (C) Resting membrane potential (t22=0.2579, p=0.7989). (D) Waveforms of light-evoked action potentials and quantification of threshold (U=65, p=0.7125), height (t22=0.6447, p=0.5258), and half-width (t22=0.8472, p=0.4060). (E) Waveforms of action potentials elicited by current injection and quantification of threshold (t22=0.1823, p=0.8571), height (t22=0.1056, p=0.9168), and half-width (t22=0.0502, p=0.9604). (F) Schematic of Arpc3 mixed hippocampal neuron cultures and current clamp recordings (WT n=14/3, KO n=13/3). (G) Probability of firing action potentials during a 20 Hz light stimulation train (two-way repeated measures ANOVA, F1,25=0.07845, p=0.7817). (H) Resting membrane potential (t25=1.068, p=0.2959). (I) Waveforms of light-evoked action potentials and quantification of threshold (t25=0.7780, p=0.4438), height (t25=0.4700, p=0.6424), and half-width (t25=2.745, p=0.0111). (J) Waveforms of action potentials elicited by current injection and quantification of threshold (t25=0.8628, p=0.3964), height (t25=0.2601, p=0.7969), and half-width (t25=2.991, p=0.0062). All data are mean ± SEM. *p<0.05, **p<0.01, n.s. not significant. t values are t-tests, and U values are Mann-Whitney U-tests.